Underlying Factors
Principal Components Results Summary
A total of 27 variables and 3852 responses were included in the principal component analysis of responses to the question, “What did you see as the barriers preventing you from being involved in the arts at the University of Michigan (if you experienced any)?”. A scree plot, dimension eigenvalues, and a loadings table for the variables included in the analysis follow at the bottom of this page.
Five dimensions (or, interchangeably, principal components) explaining a cumulative 51% of the variation were extracted for further description and analysis. Each dimension is characterized by distributions of responses that illustrate different themes that may sometimes in tension with each other. Each of these dimensions is described in more detail in the sections below.
Demographic Contrasts Results Summary
In addition, we tested for demographic patterns in the responses along each dimension, by conducting an analysis of variance (ANOVA) with a Tukey posthoc test to compare the principal component scores between demographic factor levels. Demographic variables that showed contrasts (Tukey adj.p.value < 0.05) between factor levels indicated differences that are unlikely to be due to chance. These differences may suggest an association between the direction of the demographic factors difference and the barriers described by the accompanying dimension/principal component.
The analysis revealed demographic factor level differences for Dimensions 1, 2, 4, and 5. Dimension 3 (Dialectical Complexity) showed no relationship with any of the demographic factors included in the analysis. There were school and income differences for Dimension 1. Differences for sex emerged for Dimensions 2, 4, and 5. Prior exposure to the arts was particularly relevant for Dimensions 2 and 4. Demographic factors that had associations with each of the dimensions are listed below, along with statistical tables and accompanying figures illustrating the contrasts between factor levels. A brief description accompanies each dimension to summarize the results.
Dimension 1: Personal Capacity -vs- Climate of Exclusion
Dimension 1 (the first principal component) explains about 18% of the variation among responses to the barriers question, and this dimension is characterized by responses focused on Personal Capacity in one direction, and by responses about Climate of Exclusion in the other direction.
Personal Capacity is the label given to describe one direction of this dimension; it is a synthesis of the topic variables of Time and Course Load, and LIWC.relativ, a spatial language variable indicative of location. Taken together, this direction of the dimension describes personal capacity either in terms of time, logistical effort (i.e. travel), interest, and priorities as a barrier to participating in the arts activities. Many responses indicated that their academic course load was too great (sometimes in conjunction with other more highly prioritized activities), to be involved in the arts at college. Location was also an issue, as the demands of traveling and being in multiple places often diminishes one’s personal capacity.
“Time schedule conflicting with class or other extracurriculars”
“Not enough time in my schedule to be in a club or group for pure enjoyment.”
“Large time commitment. Very intense competition”
“Might be time consuming, not really socially acceptable compared to volunteering or being in an interest group”
“I tried to join campus band, but as a freshman it was very far from where I lived. I went to the first practice and I didn’t find it as fun because the first day the people in my section were very competitive and it made me not want to join because I experienced enough competition in classes.”
Climate of Exclusion describes the other direction of this dimension, synthesizing the topic variables Unwelcoming Environment, Competitive Auditions, University Priorities, Accessibility, and Departmental Segregation. Responses in the direction of this dimension reflect a direct and interpersonal sense of exclusion, characterized by competitive auditions and unwelcoming environments. Institutional signals of exclusion were also common among these responses, driven in part by the perception of inequitable funding, attention and pride across programs, inability to access arts courses offered outside their school, and the need to actively seek out information about arts events, creating accessibility problems.
“The art department doesn’t let you use the studios unless you are taking a class in that studio.”
“I wanted to be in an a capella group and had tried out for 4-5 my sophomore and freshman year. I got called back from two different groups but didn’t make it from there. It was hard because I really wanted to be in an a capella group and not in a choir, so therefore I haven’t gotten to sing here, which makes me sad.”
“The great and sad part of UM is the wealth of talented individuals who go here– makes it hard for me, a moderately talented individual in a number of fields, to try out for a play or musical group and actually make it because I’m competing with, for example, percussion majors for Groove and theatre majors for a part in a play.”
“As an engineer, I feel there could be more opportunities to get involved in the arts. I feel too intimidated by art majors or minors to take an art class for fun, which I otherwise would do.”
“Skill Requirements and inner departmental circles. It is hard to get involved as an engineer”
“Fear of judgement”
“Kind of intimidating, somewhat a culture of arrogance at times”
“Stigma against artistic pursuits as flaky or not productive.”
Demographic Factors for Dimension 1
Students reporting family income levels of More than \\$150,000 had higher mean principal component scores along Dimension 1 — in contrast to students that reported family income levels of \\$50,000-$100,000 (Table 1). Students in the More than \\$150,000 income group were more likely to have responses that fell into the Climate of Exclusion range of Dimension 1 (Table 1; Figure 1.1).
Engineering students tended to have lower mean principal component scores along Dimension 1 in contrast to Literature, Science & the Arts students (Table 1). Engineering students were thus more likely to have responses in the Personal Capacity range of Dimension 1 (Table 1; Figure 1.2).
TABLE 1: demographic contrasts for Dimension 1
| question_name | PC_num | demographic | comparison | estimate | tukey adj.p.value |
|---|---|---|---|---|---|
| barriers | PC1 | income | More than $150,000-$50,000-$100,000 | 0.26160219 | 0.006427354 |
| barriers | PC1 | school | Engineering-Literature, Science & the Arts | -0.344558809 | 0.00769074 |
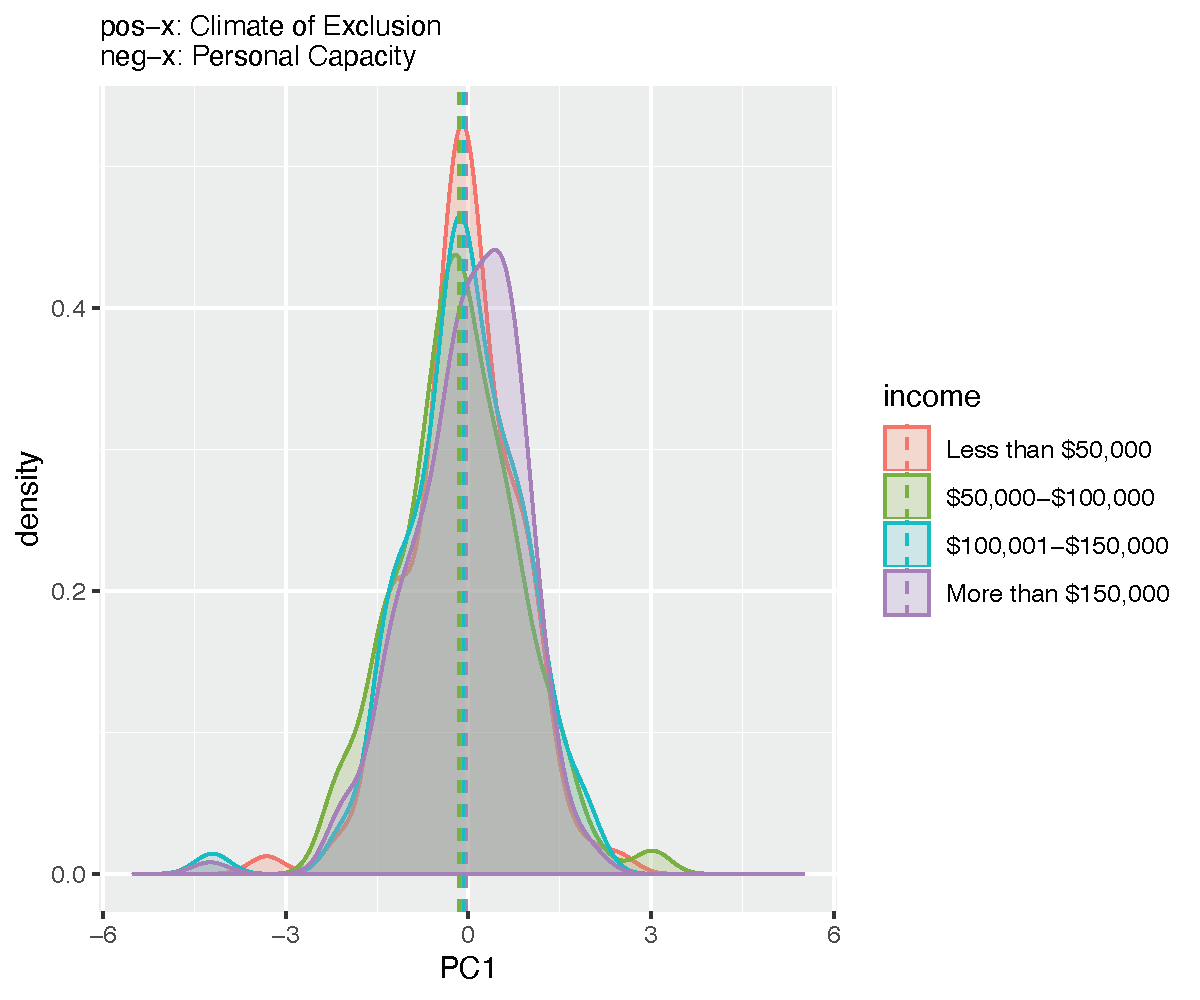
Fig. 3 Family income levels of student respondents show contrasts for Barriers Dimension 1. Demographic variables that showed contrasts (Tukey adj.p.value < 0.05) between factor levels indicated differences that are unlikely to be due to chance. These differences may suggest an association between the direction of the demographic factors difference and the barriers described by the accompanying dimension/principal component.
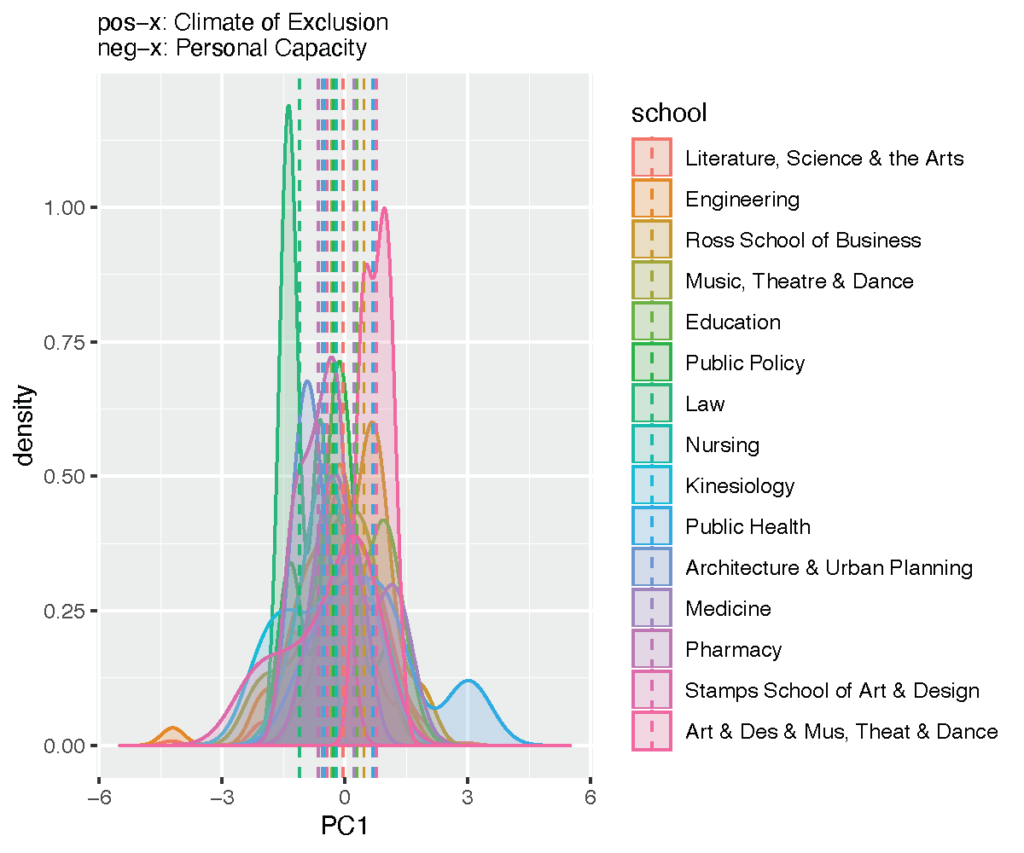
Fig. 4 This density plot shows contrasts (Tukey adj.p.value < 0.05) between factor levels for the school of student respondents. Factor levels indicated differences that are unlikely to be due to chance. These differences may suggest an association between the direction of the demographic factors differences and the barriers described by the accompanying dimension/principal component.
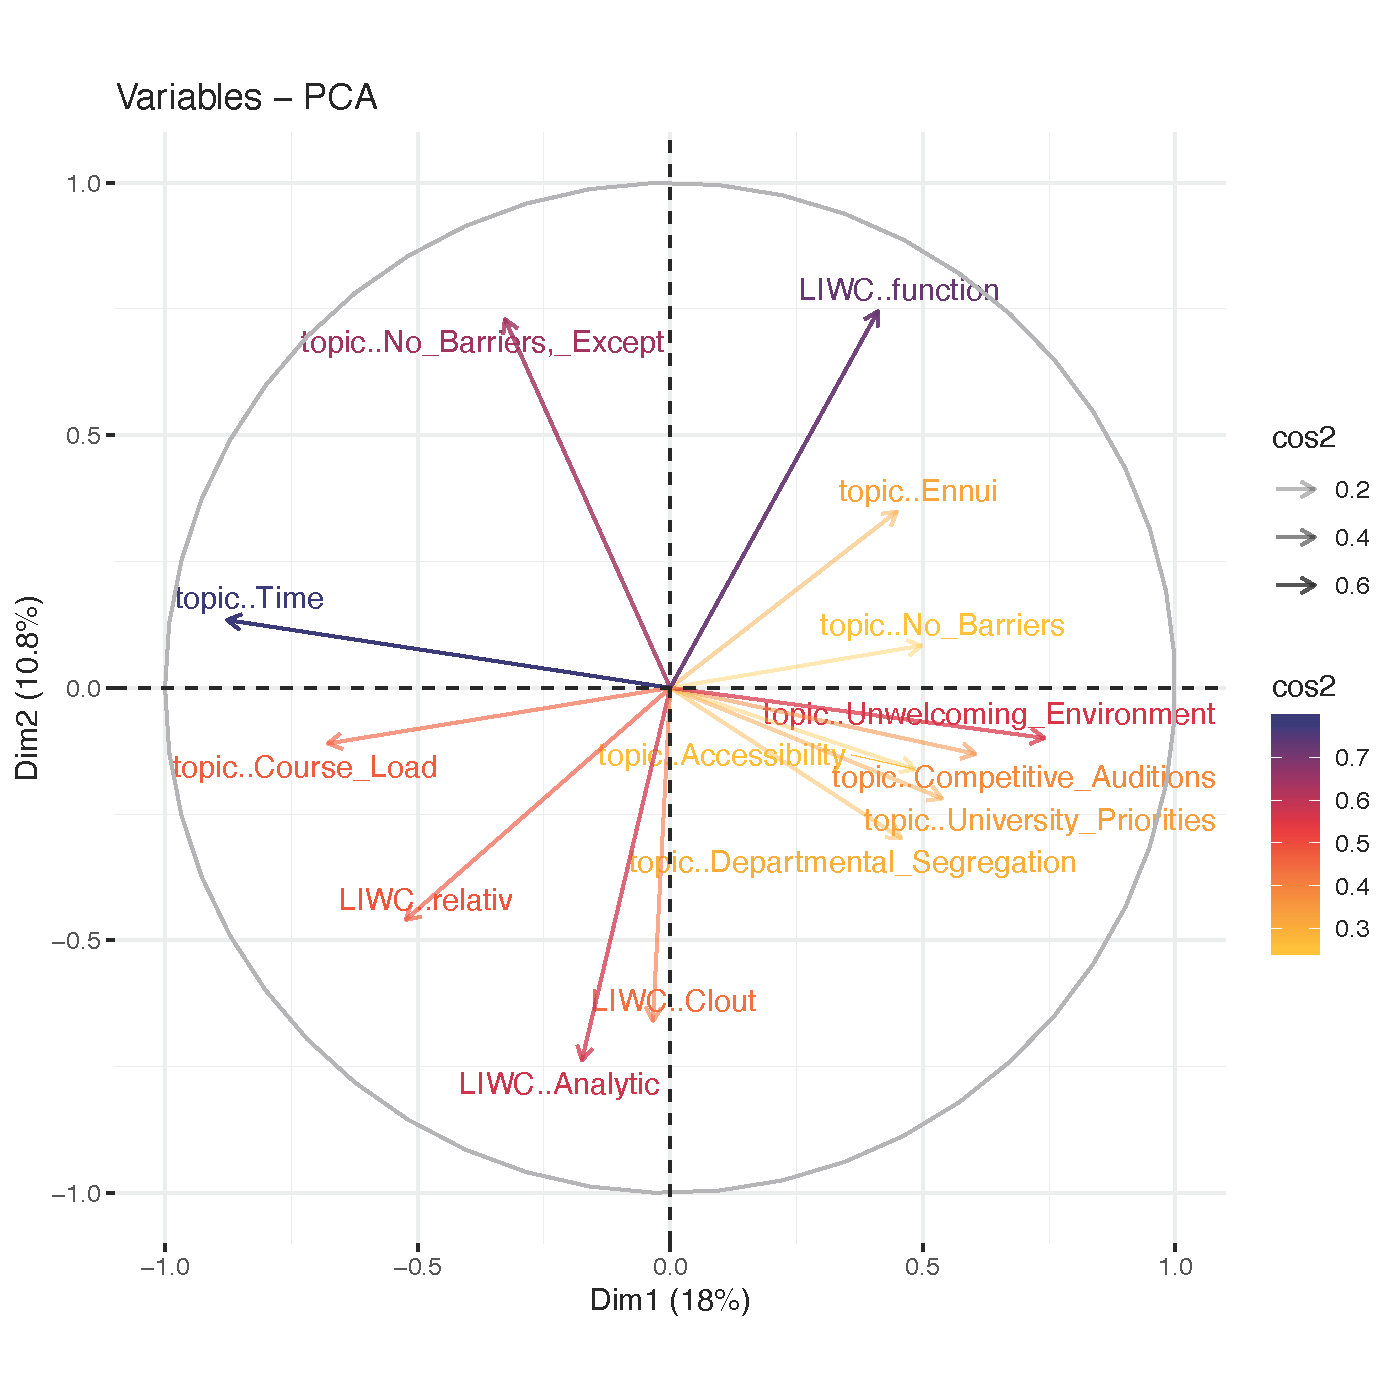
Fig. 5 ABOVE: Biplot for Dimensions 1 and 2 for Barriers
Dimension 2: Clear Barriers: Time, Major, Location, Cost -vs- Other Interests
Dimension 2 explains about 11% of the variation among responses to the barriers question, and this dimension is characterized by responses focused on Clear Barriers: Time, Major, Location, Cost in one direction, and by responses about Other Interests in the other direction.
Clear Barriers: Time, Major, Location, Cost is the label given to describe one direction of this dimension; it is a synthesis of the topic variables of LIWC..Analytic, LIWC..Clout, and LIWC..relativ. LIWC..Clout is associated with social status and lower use of first person pronouns {% cite kacewicz2014pronoun %}, while LIWC..Analytic signifies categorical language combining heightened abstract thinking, greater article use, cognitive complexity, and greater use of prepositions {% cite pennebaker2014small %}. Together, these variables and the content of the responses suggest a directness in the responses and a clearer identification of barrier categories — sometime with elaboration — but more often to the point.
“Cost, time”
“Science requirements for science majors make it difficult to take classes in the arts, and sometimes to experience extra art activities.”
“Difficult to sign up for ARTDES courses, since no contact info for professors whose permission is needed.”
Other Interests describes the other direction of this dimension, synthesizing the topic variables topic..Ennui, topic..No_Barriers,_Except, LIWC..function. The topics topic..Ennui and topic..No_Barriers,_Except show the focus on other interests in responses. The variable LIWC..function indicates a higher use of pronouns, prepositions, articles, conjunctions, and auxiliary verbs such as I, The, And, To, Of, That, In, It, and My {% cite chung2007psychological %}. Function words have been liked to a strnger focus on the self; as well as social processes such as stressors, depression, deception, status, and culture; and demographic factors of sex and age {% cite chung2007psychological %}.
“Do not have the time and I have other interests”
“No barriers. Just my other interests are higher than my desire to be involved in the arts most of the time”
“The only barriers I see is the impracticality of being involved in the arts as a pre-medical mathematics major.”
Demographic Factors for Dimension 2
A vartiety of demographic variables showed contrasts for Dimension 2. Many of the variables were related to prior experience with the arts — such as having participated in the arts in college, frequency of participation in high school, if students were encouraged in the arts in high school, and whether the arts was something that their parents exposed them to dduring childhood. This suggests two things. First, prior exposure in the arts appears to have a strong, underlying impact on whether students are likely to cite Other Interests as a barrier to arts involvement. The second is that multiple factors impact prior experiences in the arts, from childhood exposure, to availability, encouragement, and actual participation.
TABLE 1: demographic contrasts for Dimension 2
| question_name | PC_num | demographic | comparison | estimate | tukey adj.p.value |
|---|---|---|---|---|---|
| barriers | PC2 | sex | Female-Male | -0.15176169 | 0.002629354 |
| barriers | PC2 | artsincollege | Yes-No | -0.396376576 | 3.26E-09 |
| barriers | PC2 | hs_arts_freq | Occasionally-Never | -0.605654184 | 2.65E-08 |
| barriers | PC2 | hs_arts_freq | Frequently-Never | -0.922648271 | 3.39E-09 |
| barriers | PC2 | hs_arts_freq | Frequently-Occasionally | -0.316994087 | 3.45E-09 |
| barriers | PC2 | hs_encouragement | Yes-No | -0.183150322 | 0.000299571 |
| barriers | PC2 | hs_fees | Yes-No | -0.138803489 | 0.004038041 |
| barriers | PC2 | hstype | Private religious-Traditional public | 0.235876907 | 0.022034534 |
| barriers | PC2 | hstype | Private non-religious-Private religious | -0.517439319 | 0.00075395 |
| barriers | PC2 | parented | Ph.D or professional degree-Bachelor’s | -0.284336045 | 0.000168483 |
| barriers | PC2 | sr_participated | Yes-No | -0.406484092 | 1.94E-08 |
| barriers | PC2 | so_childhood1 | No-Yes | 0.282730234 | 4.35E-05 |
| barriers | PC2 | so_childhood3 | No-Yes | 0.210865826 | 2.54E-05 |
| barriers | PC2 | so_childhood5 | No-Yes | 0.178594572 | 0.000154203 |
Sex
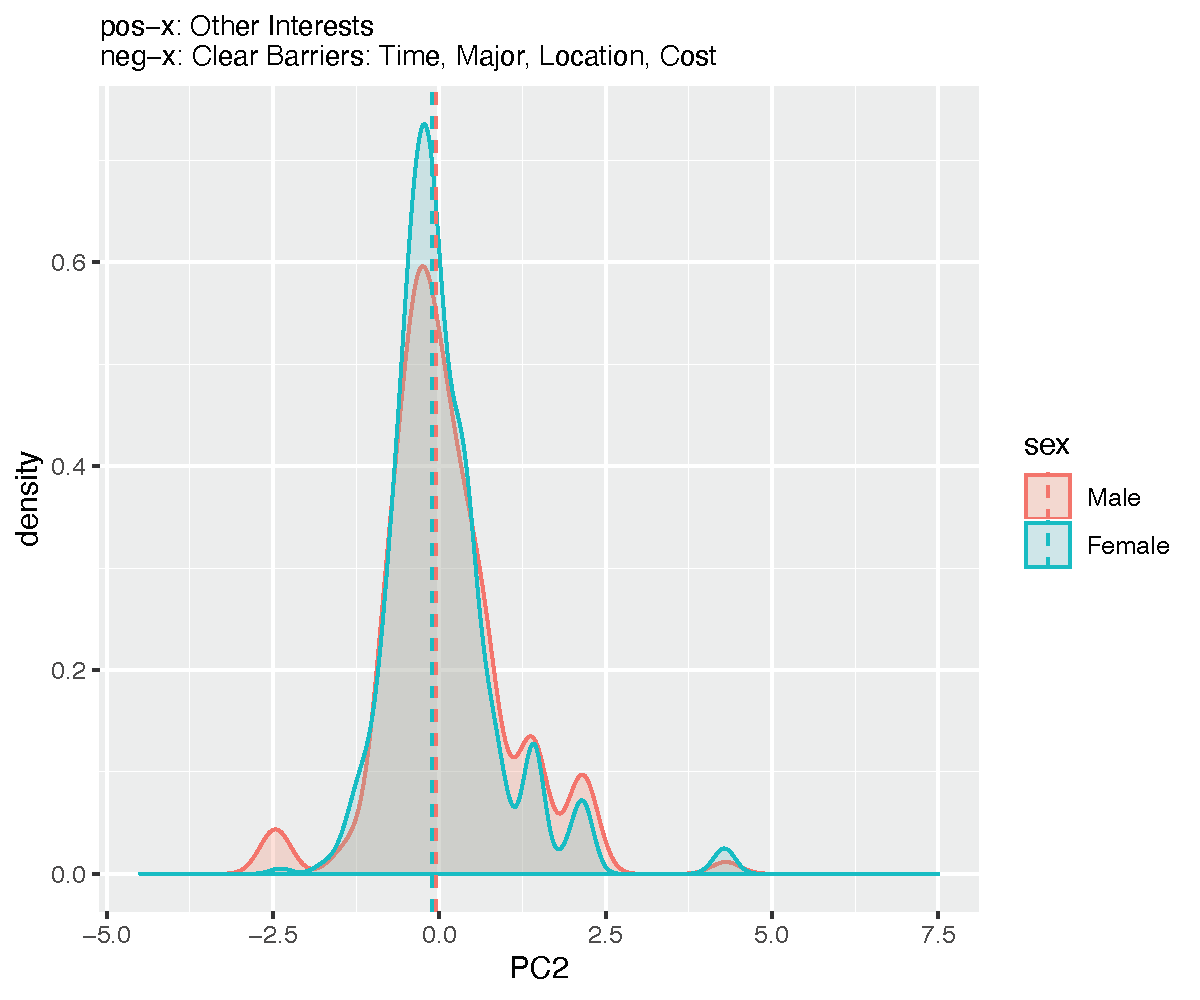
Fig. 6 ABOVE: Demographic variables that showed contrasts (Tukey adj.p.value < 0.05) between factor levels indicated differences that are unlikely to be due to chance. These differences may suggest an association between the direction of the demographic factors difference and the barriers described by the accompanying dimension/principal component.
Parent Education
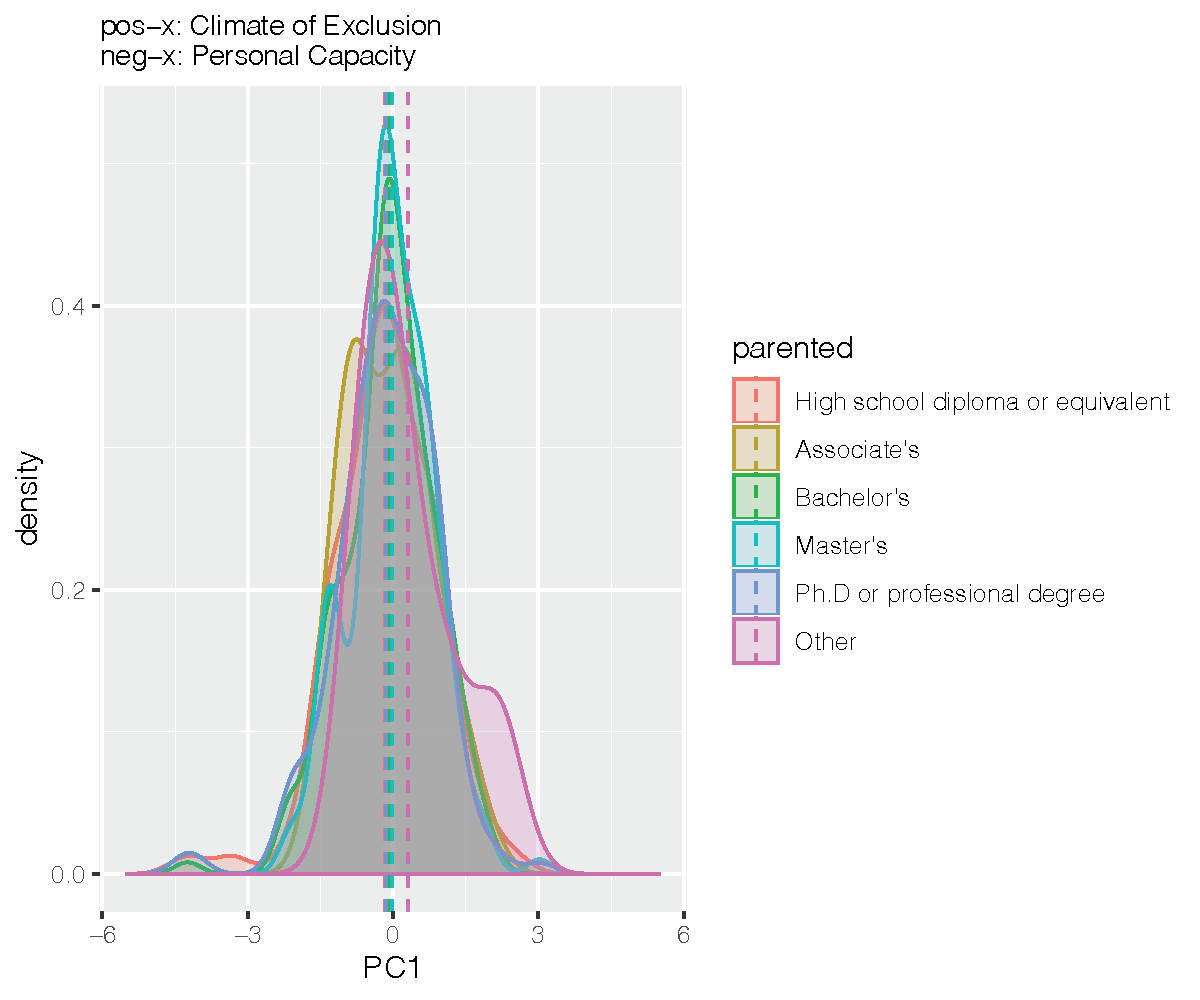
Fig. 7 ABOVE: Demographic variables that showed contrasts (Tukey adj.p.value < 0.05) between factor levels indicated differences that are unlikely to be due to chance. These differences may suggest an association between the direction of the demographic factors difference and the barriers described by the accompanying dimension/principal component.
Participated in the Arts
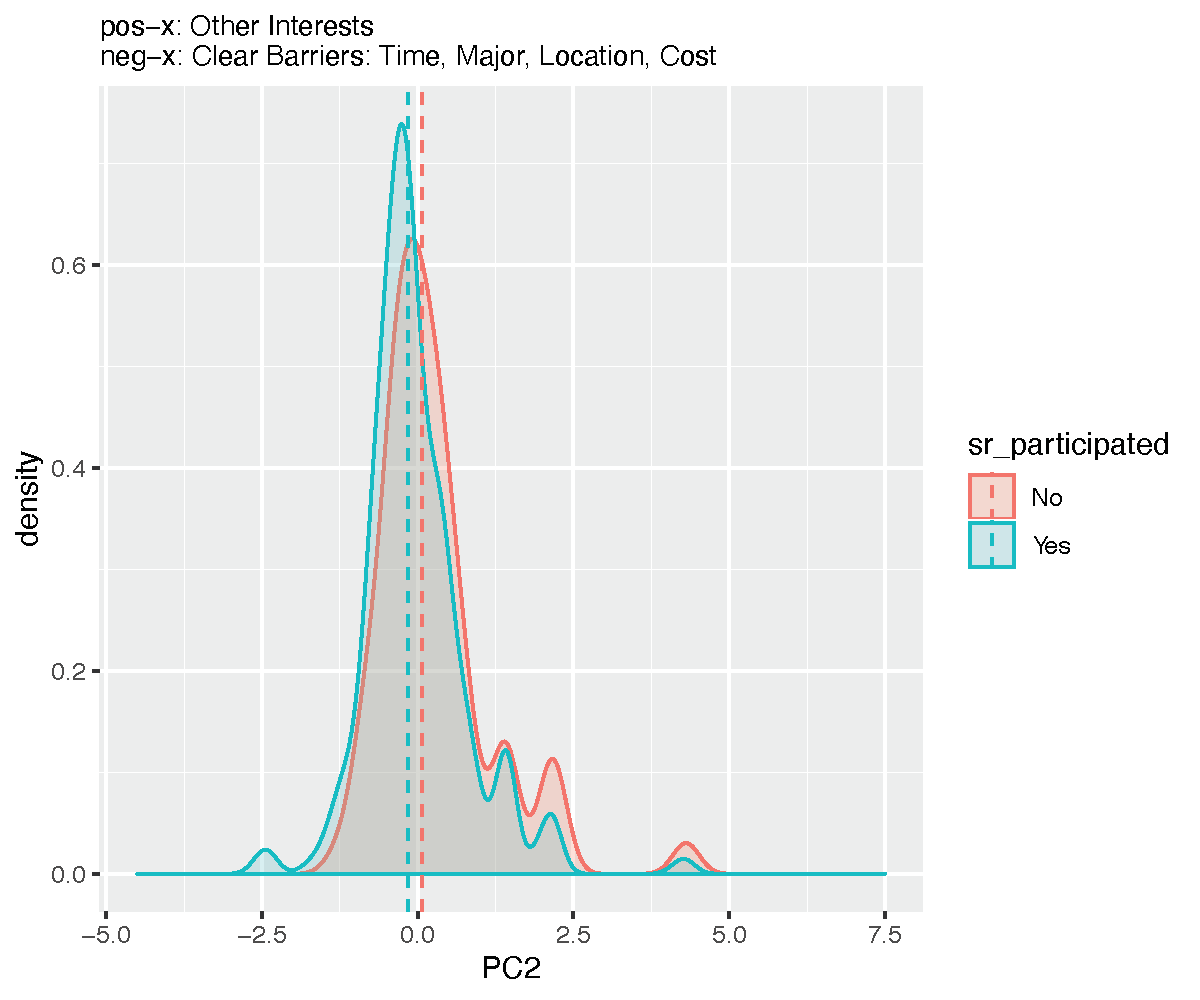
Fig. 8 ABOVE: Demographic variables that showed contrasts (Tukey adj.p.value < 0.05) between factor levels indicated differences that are unlikely to be due to chance. These differences may suggest an association between the direction of the demographic factors difference and the barriers described by the accompanying dimension/principal component.
so_childhood5
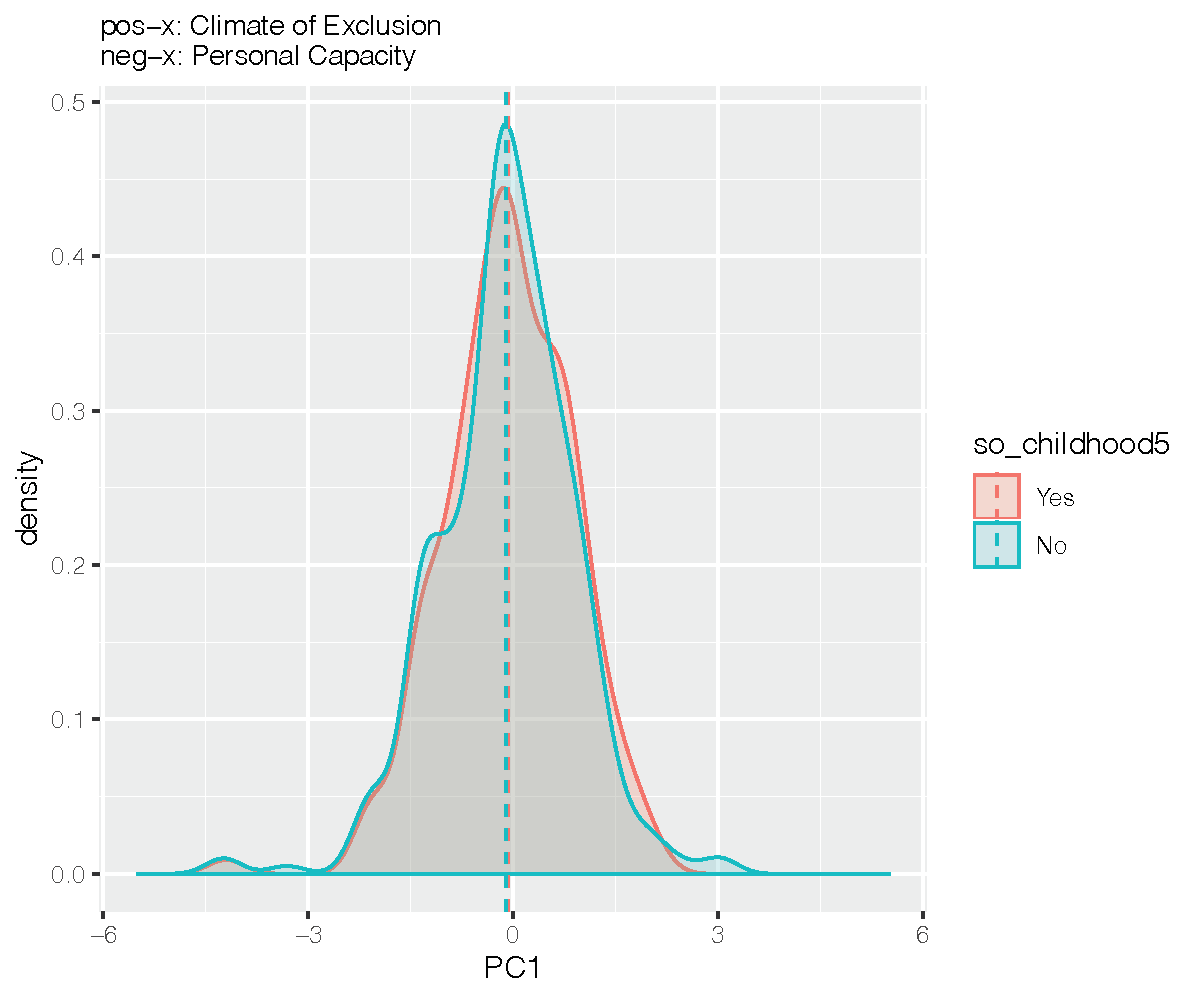
Fig. 9 ABOVE: Demographic variables that showed contrasts (Tukey adj.p.value < 0.05) between factor levels indicated differences that are unlikely to be due to chance. These differences may suggest an association between the direction of the demographic factors difference and the barriers described by the accompanying dimension/principal component.
so_childhood3
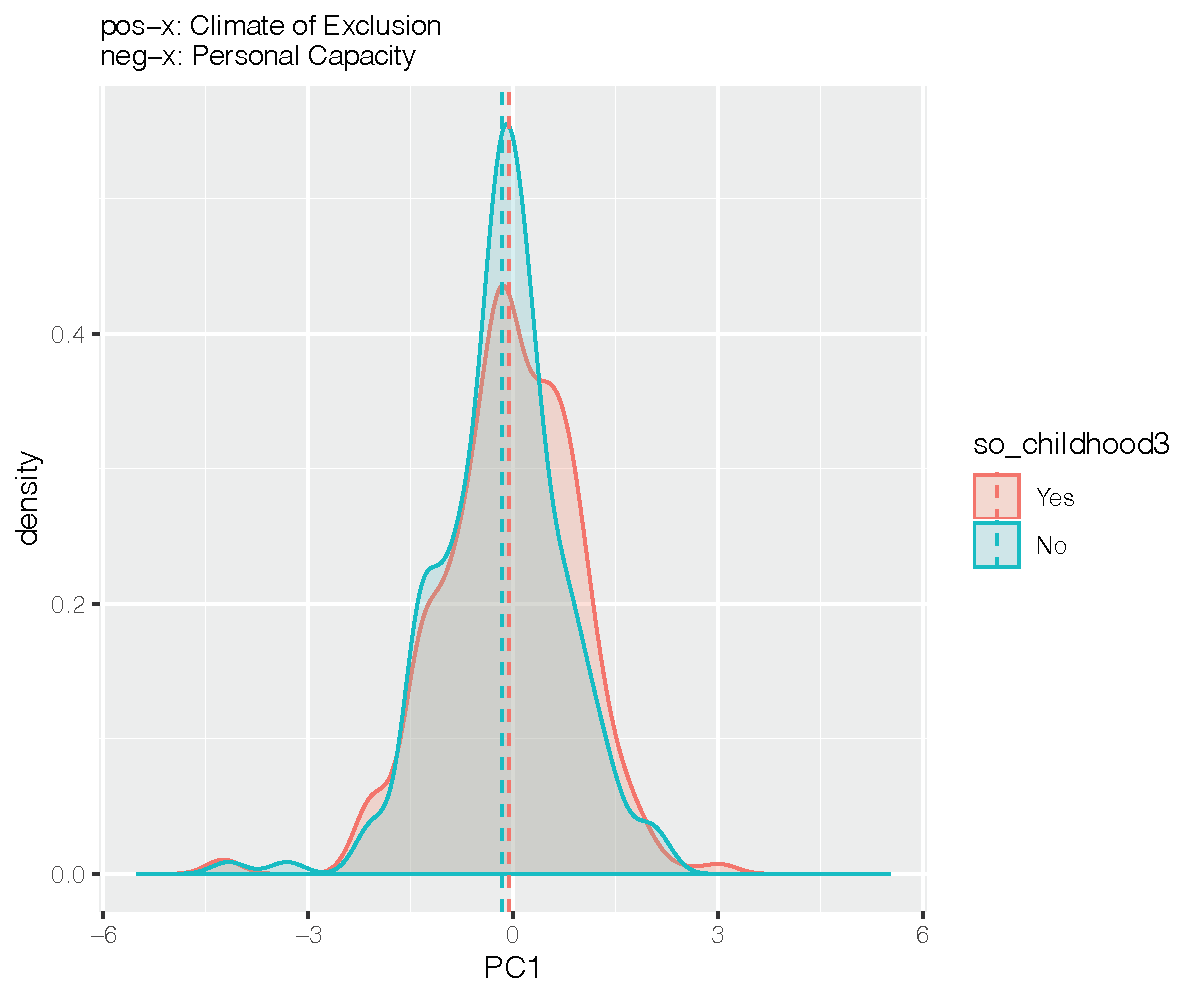
Fig. 10 ABOVE: Demographic variables that showed contrasts (Tukey adj.p.value < 0.05) between factor levels indicated differences that are unlikely to be due to chance. These differences may suggest an association between the direction of the demographic factors difference and the barriers described by the accompanying dimension/principal component.
so_childhood1
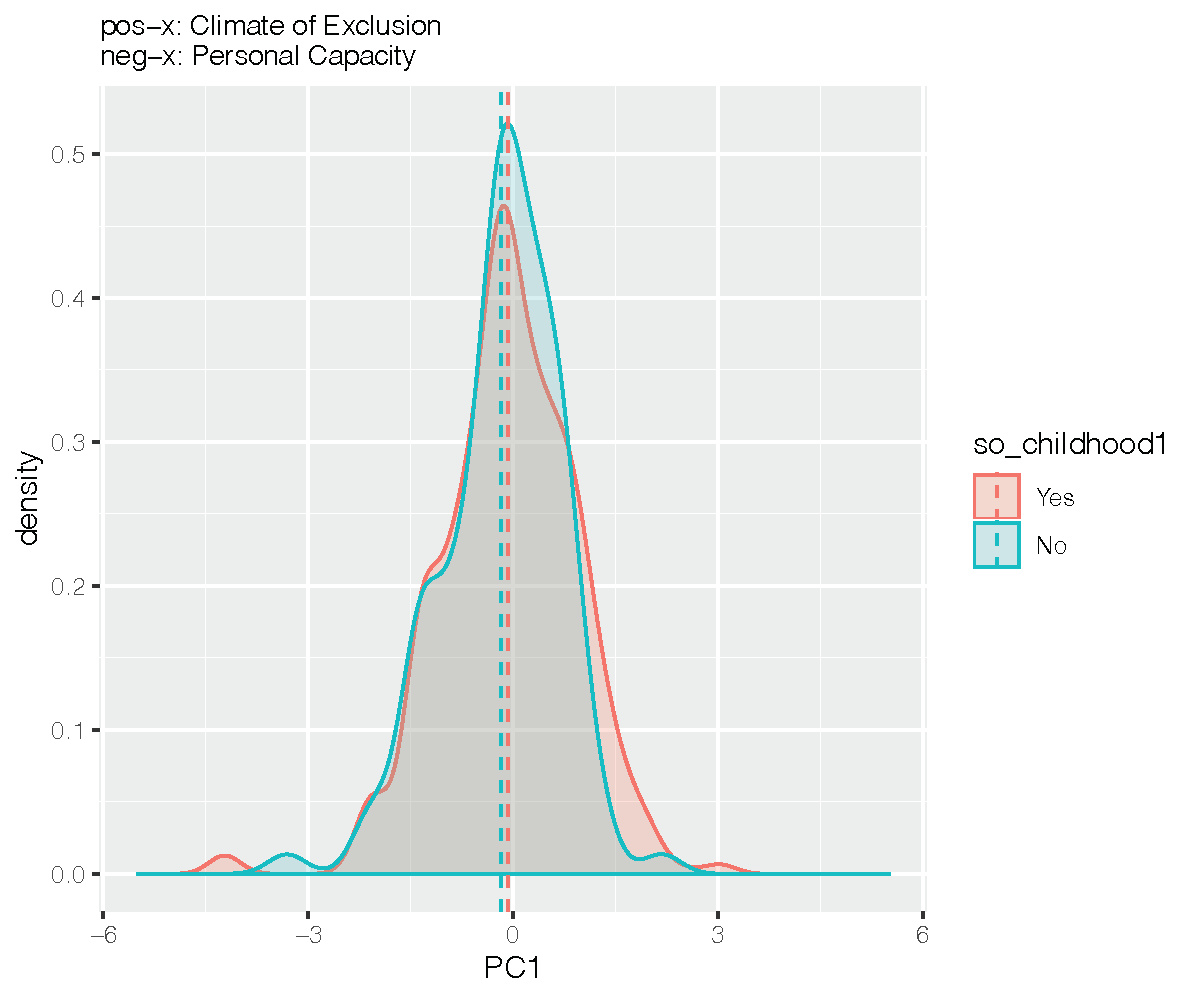
Fig. 11 ABOVE: Demographic variables that showed contrasts (Tukey adj.p.value < 0.05) between factor levels indicated differences that are unlikely to be due to chance. These differences may suggest an association between the direction of the demographic factors difference and the barriers described by the accompanying dimension/principal component.
High School Type
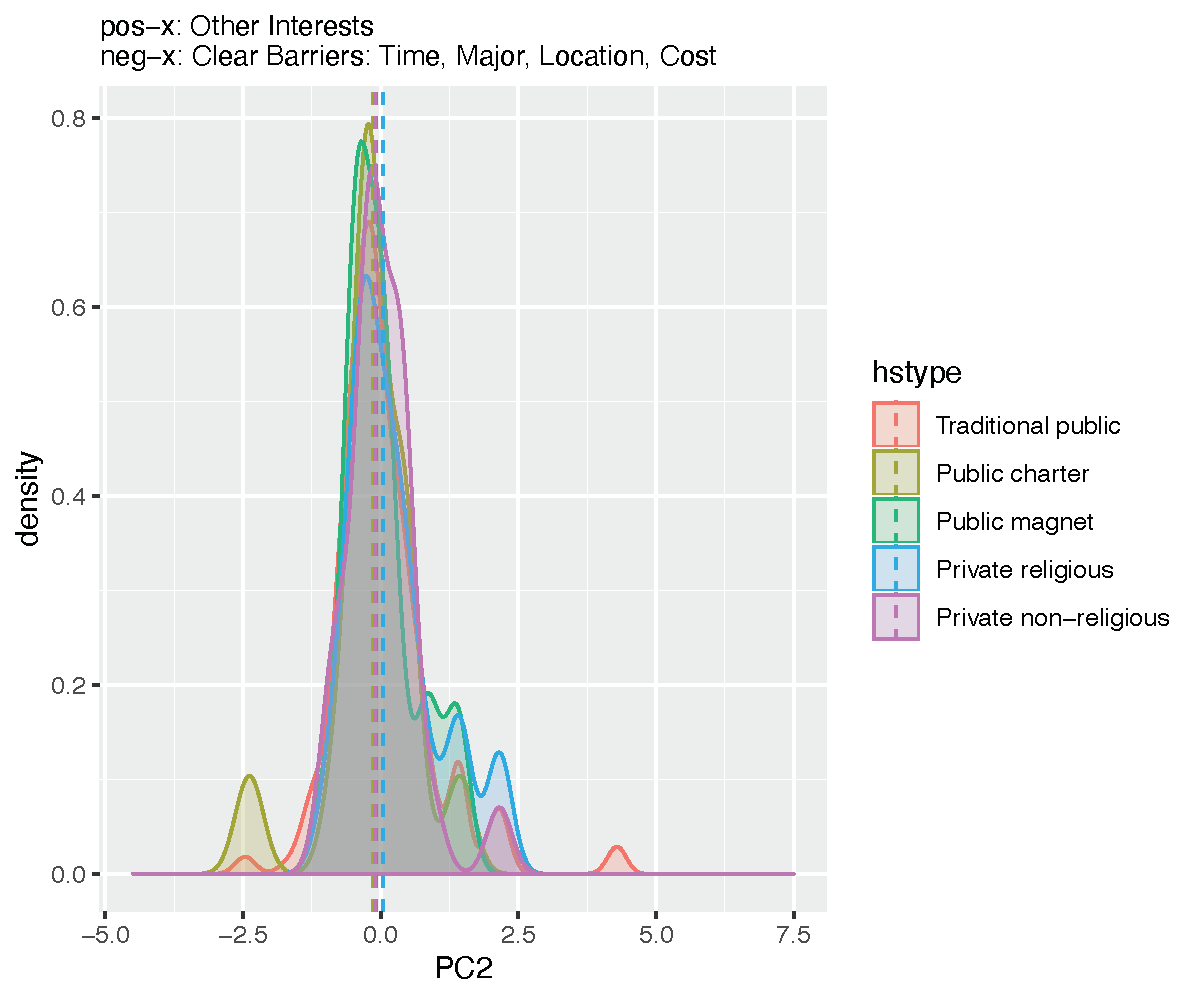
Fig. 12 ABOVE: Demographic variables that showed contrasts (Tukey adj.p.value < 0.05) between factor levels indicated differences that are unlikely to be due to chance. These differences may suggest an association between the direction of the demographic factors difference and the barriers described by the accompanying dimension/principal component.
High School Fees
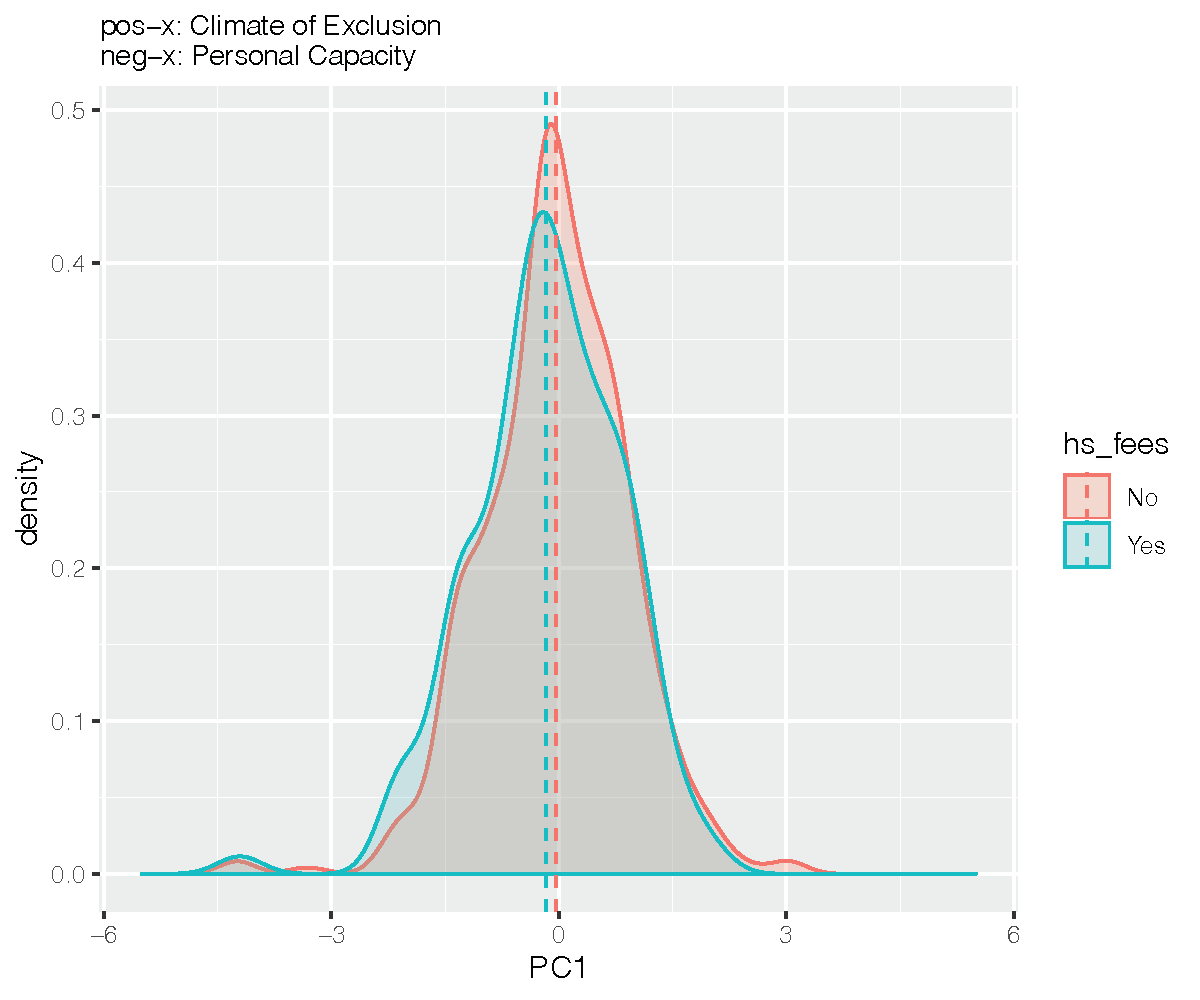
Fig. 13 ABOVE: Demographic variables that showed contrasts (Tukey adj.p.value < 0.05) between factor levels indicated differences that are unlikely to be due to chance. These differences may suggest an association between the direction of the demographic factors difference and the barriers described by the accompanying dimension/principal component.
Encouraged in High School
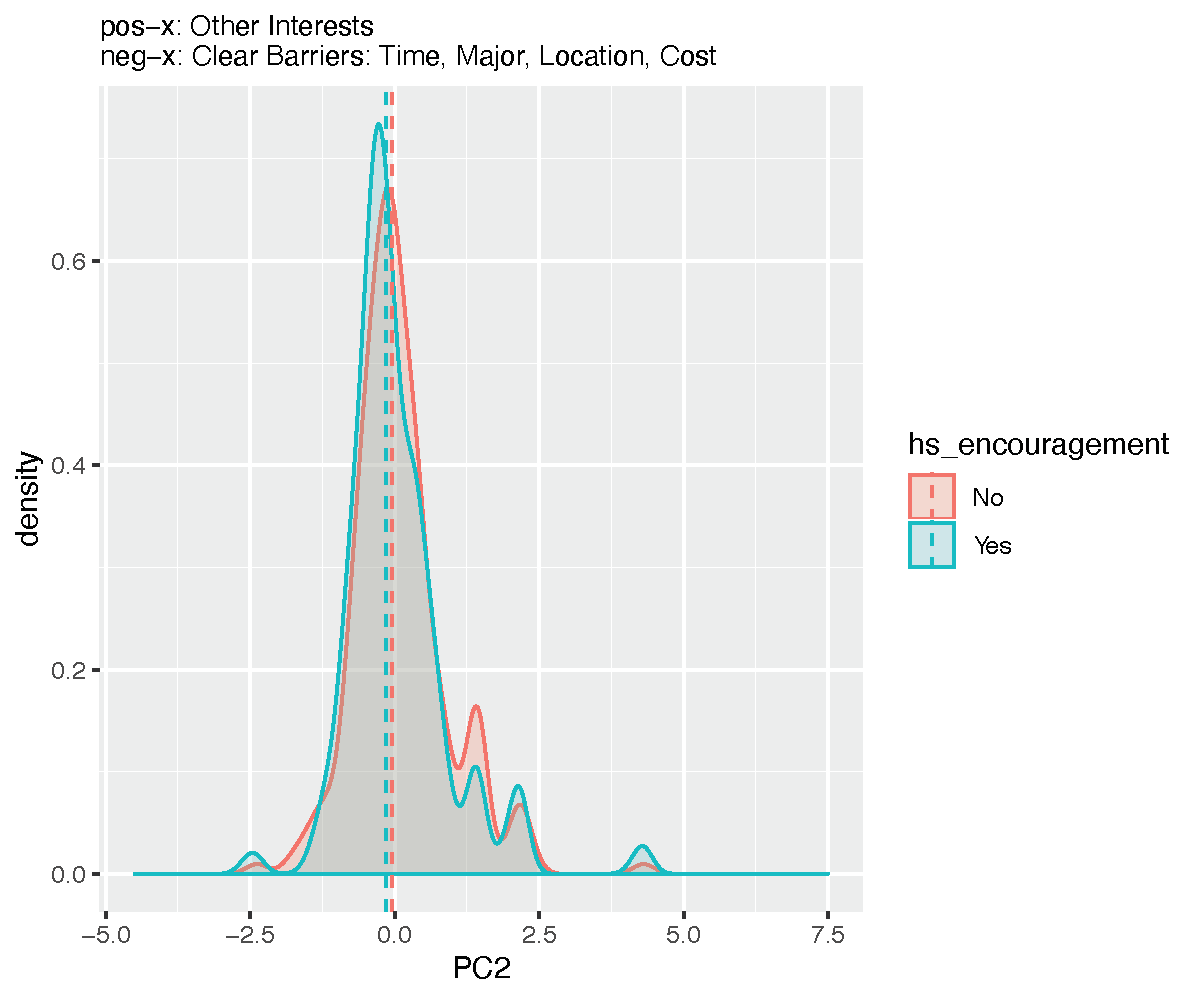
Fig. 14 ABOVE: Demographic variables that showed contrasts (Tukey adj.p.value < 0.05) between factor levels indicated differences that are unlikely to be due to chance. These differences may suggest an association between the direction of the demographic factors difference and the barriers described by the accompanying dimension/principal component.
High School Arts Participation Frequency
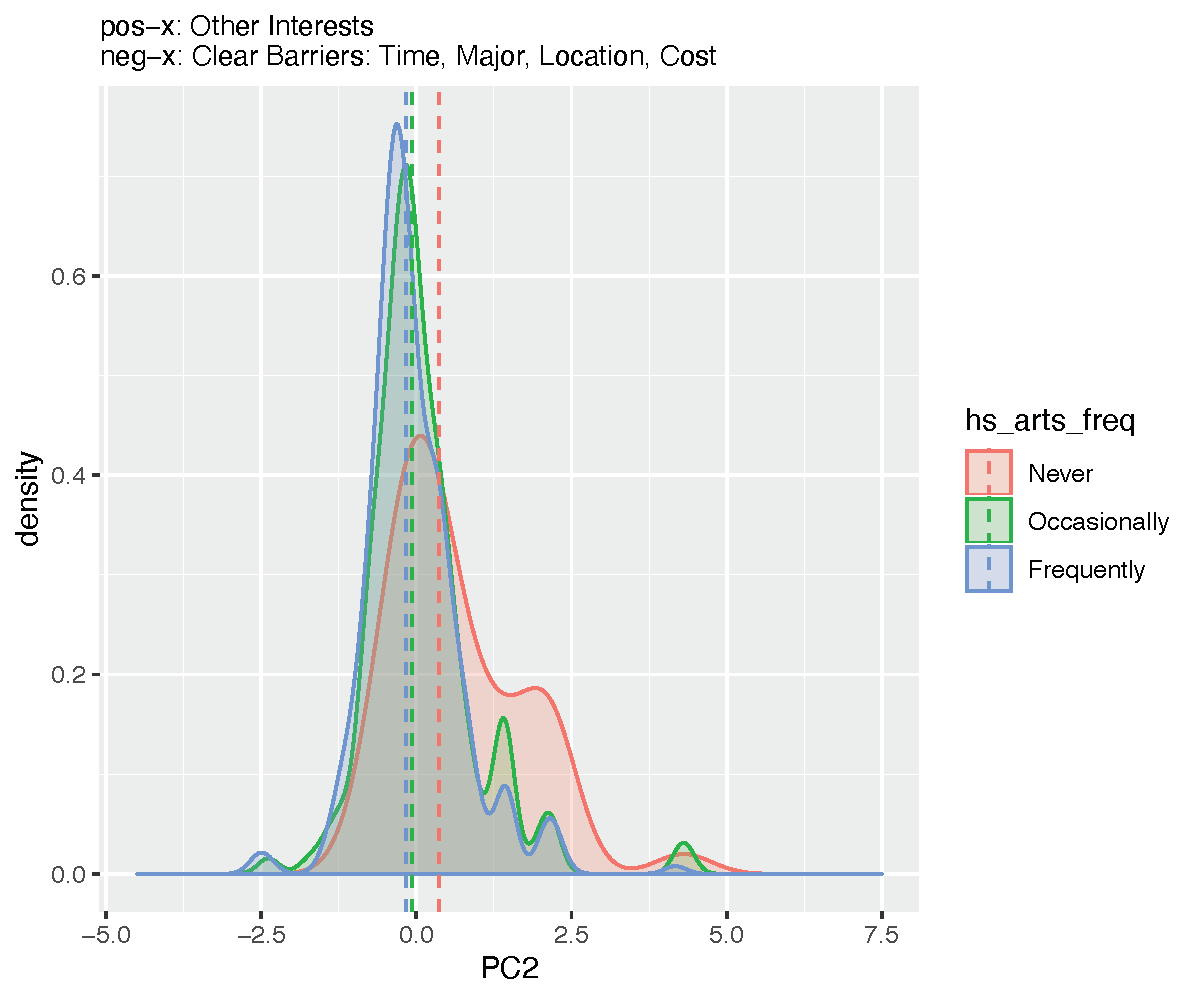
Fig. 15 ABOVE: Demographic variables that showed contrasts (Tukey adj.p.value < 0.05) between factor levels indicated differences that are unlikely to be due to chance. These differences may suggest an association between the direction of the demographic factors difference and the barriers described by the accompanying dimension/principal component.
Arts in College
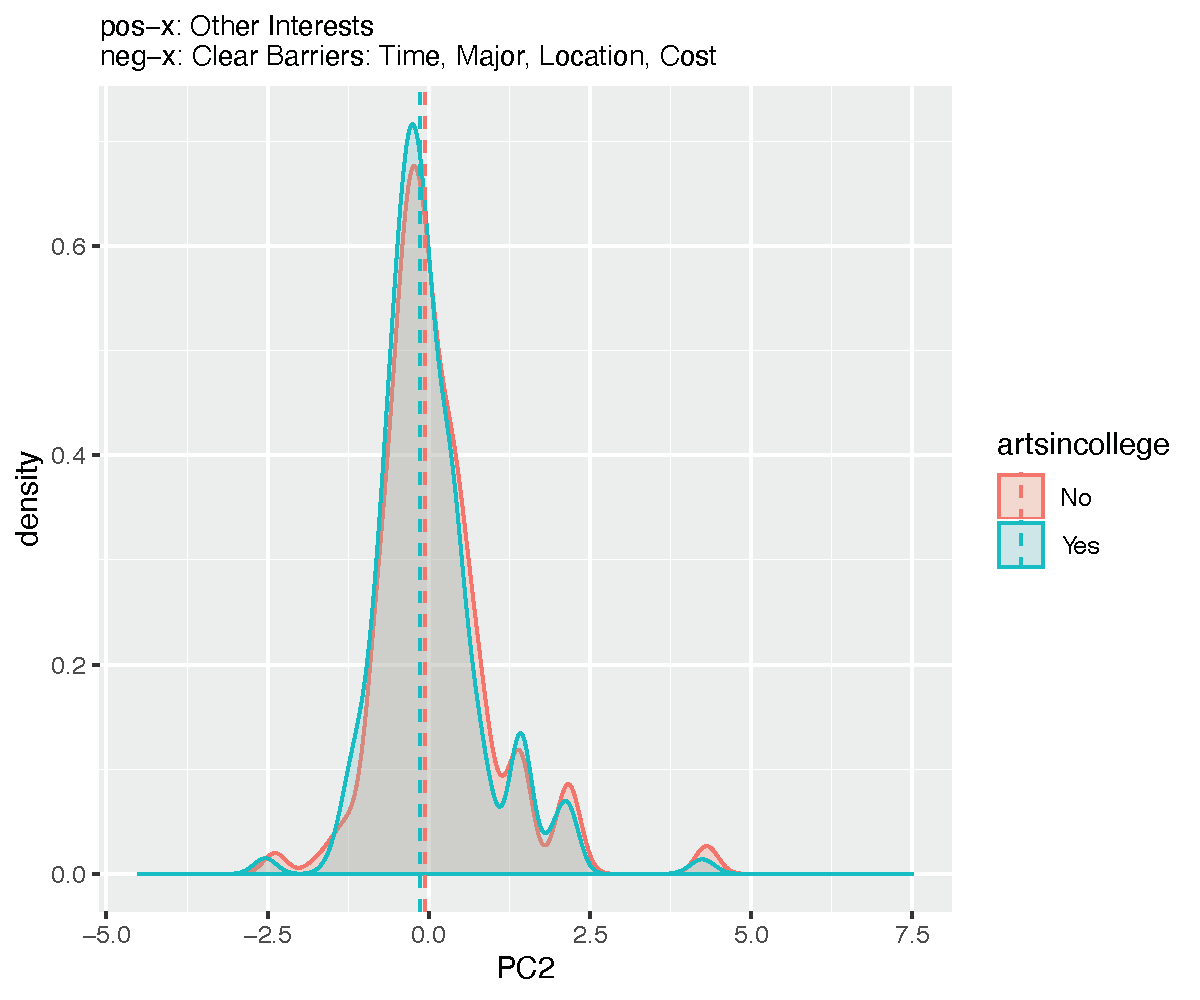
Fig. 16 ABOVE: Density plot of income contrasts Demographic variables that showed contrasts (Tukey adj.p.value < 0.05) between factor levels indicated differences that are unlikely to be due to chance. These differences may suggest an association between the direction of the demographic factors difference and the barriers described by the accompanying dimension/principal component.
Dimension 3: Dialectical Complexity (more -vs- less)
Dimension 2 explains about 9% of the variation among responses to the barriers question. This dimension is characterized by higher vs lesser degrees of Dialectical Complexity in the structure of their responses. The variables contributing to Dialectical Complexity were AIC..IC, AIC..DIAL, and AIC..ELAB. While the responses exhibit integrative complexity, they also exhibit a more specific form, Dialectical Complexity, indicating some form of tension is involved. This makes intuitive sense given that many of the responses are describing trade-offs in their lives, tensions that they are reconciling, and competing commitments and interests. A description of Integrative Complexity and Dialectical Complexity measurements and variables can be found in the AIC methods section.
“It’s difficult to find time to do art, I have too much schoolwork and the only way I can do art is if I incorporate it into my schoolwork. Another barrier is I’m get intimidated by other’s arts, so I keep my art to myself most of the time.”
“The main reason was I was not very involved in the arts while in college was that I became busy with things that do not often incorporate the arts. I am a mechanical engineering student which did not allow for much if any artistic components in my coursework, and at the same time do not think that I was surrounded by many class-mates who were interested in the arts. I also joined a social fraternity which emphasized aspects such as social, philanthropy, and sports, but overall was not an environment that emphasized the arts. I think that the barriers were therefore by personal choice and mainly due to incompatibilities with my activities.”
“There are monetary costs for attending art events and performances, as well as other social group-based disparities. A lack of an academic focus in the arts, I think, may have limited my involvement in college as compared to high school where some art was required.”
An encouraging outcome is that no demographic contrasts were observed for Dimension 3. Given that these variables measured the apparent cognitive complexity of the students’ responses, we would not expect to see an association with any of the demographic factors tested.
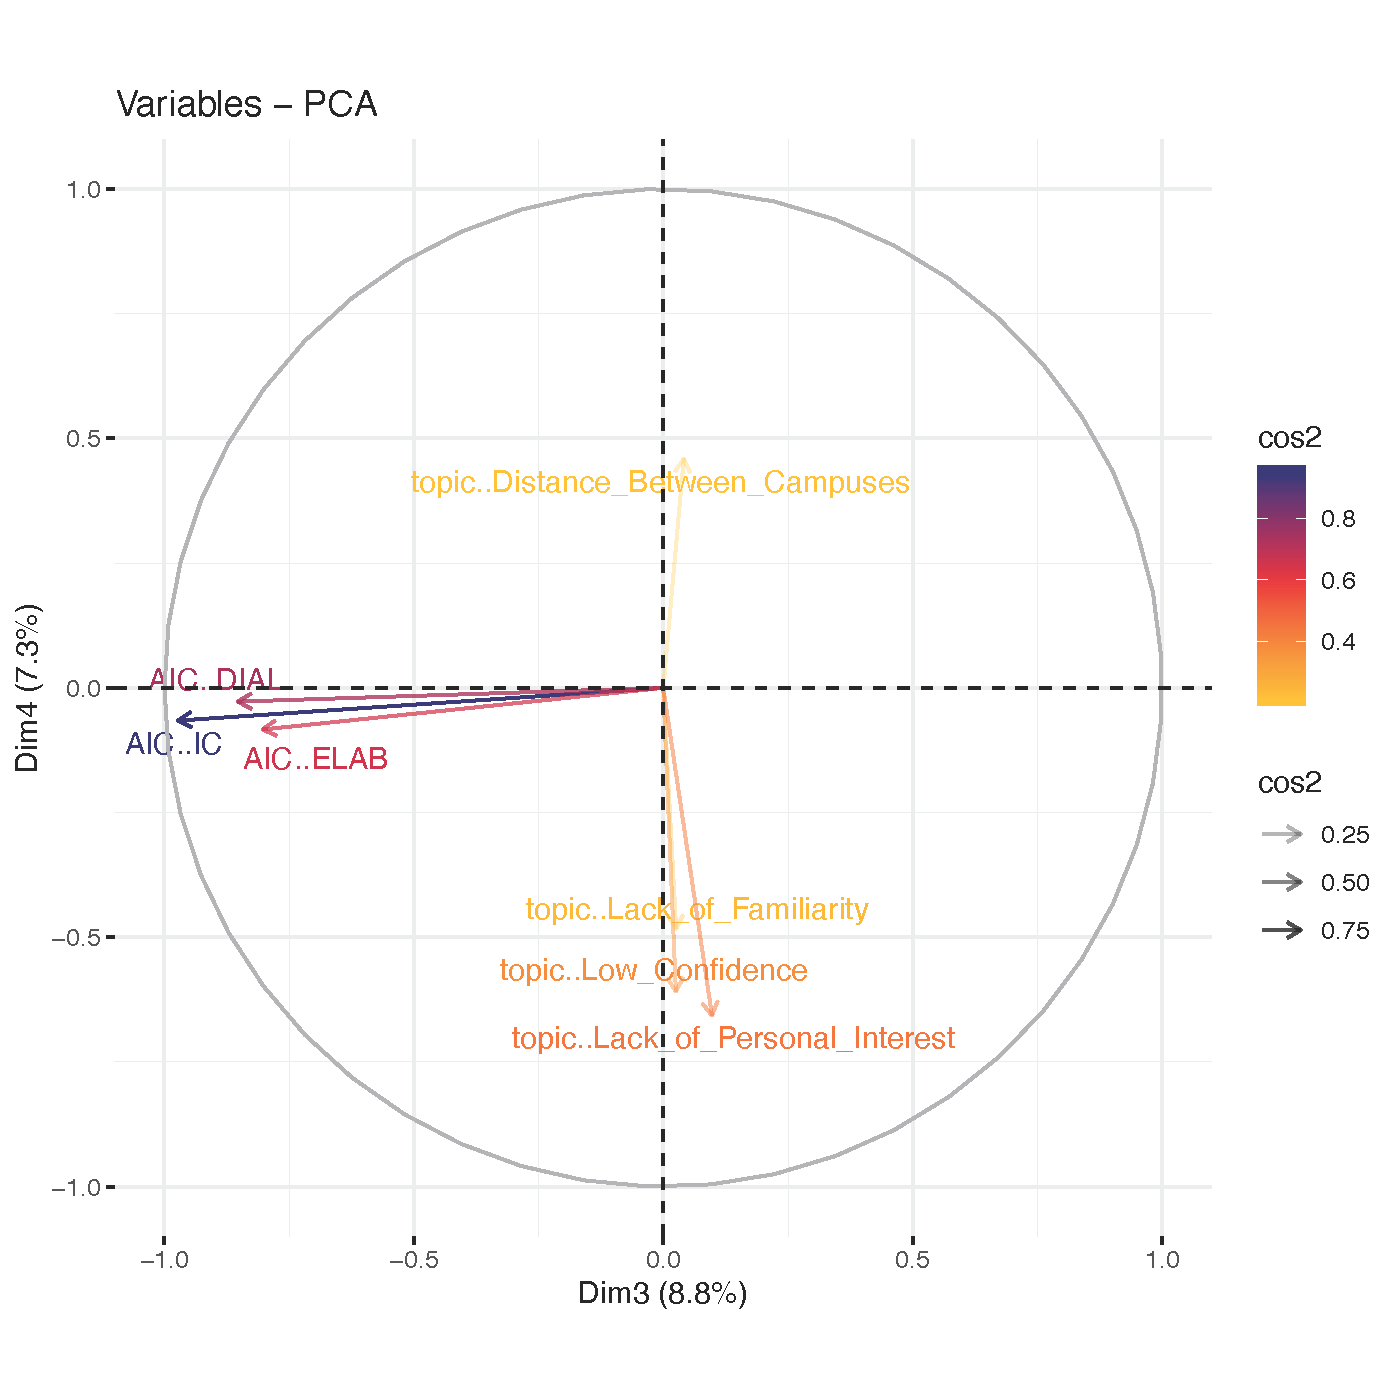
Fig. 17 ABOVE: Biplot for Dimensions 3 and 4 for ‘Barriers
Dimension 4: Lack of Personal Interest, Confidence, & Familiarity -vs- Distance Between Campuses & Awareness
Dimension 4 explains about 7% of the variation among responses to the barriers question, and this dimension is characterized by responses focused on Lack of Personal Interest, Confidence, & Familiarity in one direction, and by responses about Distance Between Campuses & Awareness in the other direction. The variables contributing to Lack of Personal Interest, Confidence, and/or Familiarity include topic..Lack_of_Personal_Interest,topic..Low_Confidence, topic..Lack_of_Familiarity. The variables contributing to Distance Between Campuses & Awareness include topic..Distance_Between_Campuses, topic..Awareness.
Lack of Personal Interest, Confidence, and/or Familiarity describes the nexus of academic course offerings, co-curricular opportunities, the level of a course relative to the student’s proficiency, the constraints of one’s major, and the fit, sequence, and timing of scheduling, as well as one’s overall course load. Responses in the direction of
“Never really saw an opportunity.”
“Lack of information, lack of enthusiasm from other students, lack of organization”
“Does not help me build my resume”
“I didn’t experience any barriers, I just didn’t have a very strong interest in the arts coming into college so I didn’t choose to involve myself much in the arts.”
“I’m not talented enough.”
“Because I am not skilled in the arts. I feels as though I wouldn’t be able to benefit in being a participant in the arts such as plays or visual art displays”
Distance Between Campuses & Awareness, in a fairly straightforward way, describes responses that gravitate towards issues of mobility, transportation, getting from A to B, carrying instruments, weather conditions, and event awareness.
“Cello difficult to take to rehearsal area all the way near Elbel Field”
“Distance – Especially in the winter. I live in Central Campus and the practices were held in North Campus at nights”
“It was always on central campus and I live more on the Hill part of campus so I wouldn’t want to walk a distance at night just to go do something. I did however do stuff on my own at my apartment.”
“Distance of home from campus. Commute time made it difficult to participate in student orgs/activities outside of class.”
“The north campus/central campus thing. I feel like there is a great divide, and I often end up missing events that happen because I don’t know about them”
“I feel that things either aren’t very well advertised or advertised in such a way that doesn’t feel accessible to someone who is not a member of the coordinating organization”
What distinguishes the Distance Between Campuses & Awareness in Dimension 4 from Access: Location and Awareness in Dimension 5? Seemingly little. However, the main difference between dimensions 4 and 5 appears to be a distinction between barriers linked to factors that individual students have some control over (in the case of Lack of Personal Interest, Confidence, and/or Familiarity in Dimension 4) and factors that may be more institutionally driven (in the case of Course Availability in Dimension 5).
Demographic Factors for Dimension 4
Women were more likely to cite Distance Between Campuses & Awareness as a barrier in their responses in contrast to men (Table 4; Figure 4.1). Similar to other observations, prior exposure and participation in the arts has a stronger association to material barriers such as Distance Between Campuses & Awareness, and less of an association with Lack of Personal Interest, Confidence, and/or Familiarity. Put another way, prior exposure and participation in the arts — like many things — may be significant factor in broadening personal interests, confidence and familiarity.
TABLE 4: demographic contrasts for Dimension 4
| question_name | PC_num | demographic | comparison | estimate | tukey adj.p.value |
|---|---|---|---|---|---|
| barriers | PC4 | so_childhood3 | No-Yes | -0.123135318 | 0.002225545 |
| barriers | PC4 | sr_participated | Yes-No | 0.213185631 | 0.00012729 |
| barriers | PC4 | so_childhood1 | No-Yes | -0.203801812 | 0.000244114 |
| barriers | PC4 | sex | Female-Male | 0.103809041 | 0.009134532 |
| barriers | PC4 | hs_arts_freq | Occasionally-Never | 0.305205205 | 0.000760975 |
| barriers | PC4 | hs_arts_freq | Frequently-Never | 0.423756045 | 1.05E-06 |
| barriers | PC4 | hs_arts_freq | Frequently-Occasionally | 0.11855084 | 0.004648511 |
| barriers | PC4 | artsincollege | Yes-No | 0.240217457 | 3.31E-09 |
Sex
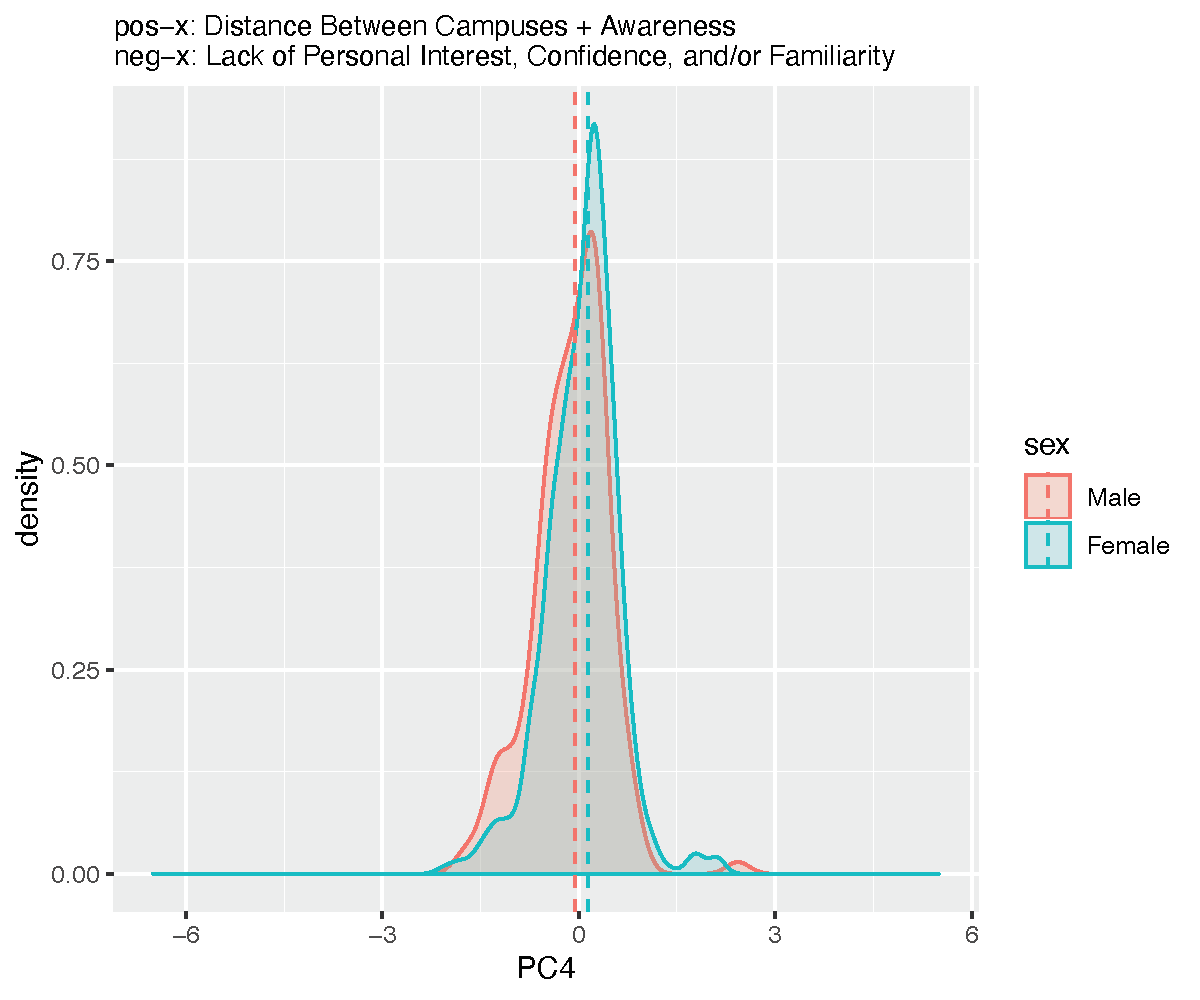
Fig. 18 ABOVE: Density plot of income contrasts Demographic variables that showed contrasts (Tukey adj.p.value < 0.05) between factor levels indicated differences that are unlikely to be due to chance. These differences may suggest an association between the direction of the demographic factors difference and the barriers described by the accompanying dimension/principal component.
so_childhood3
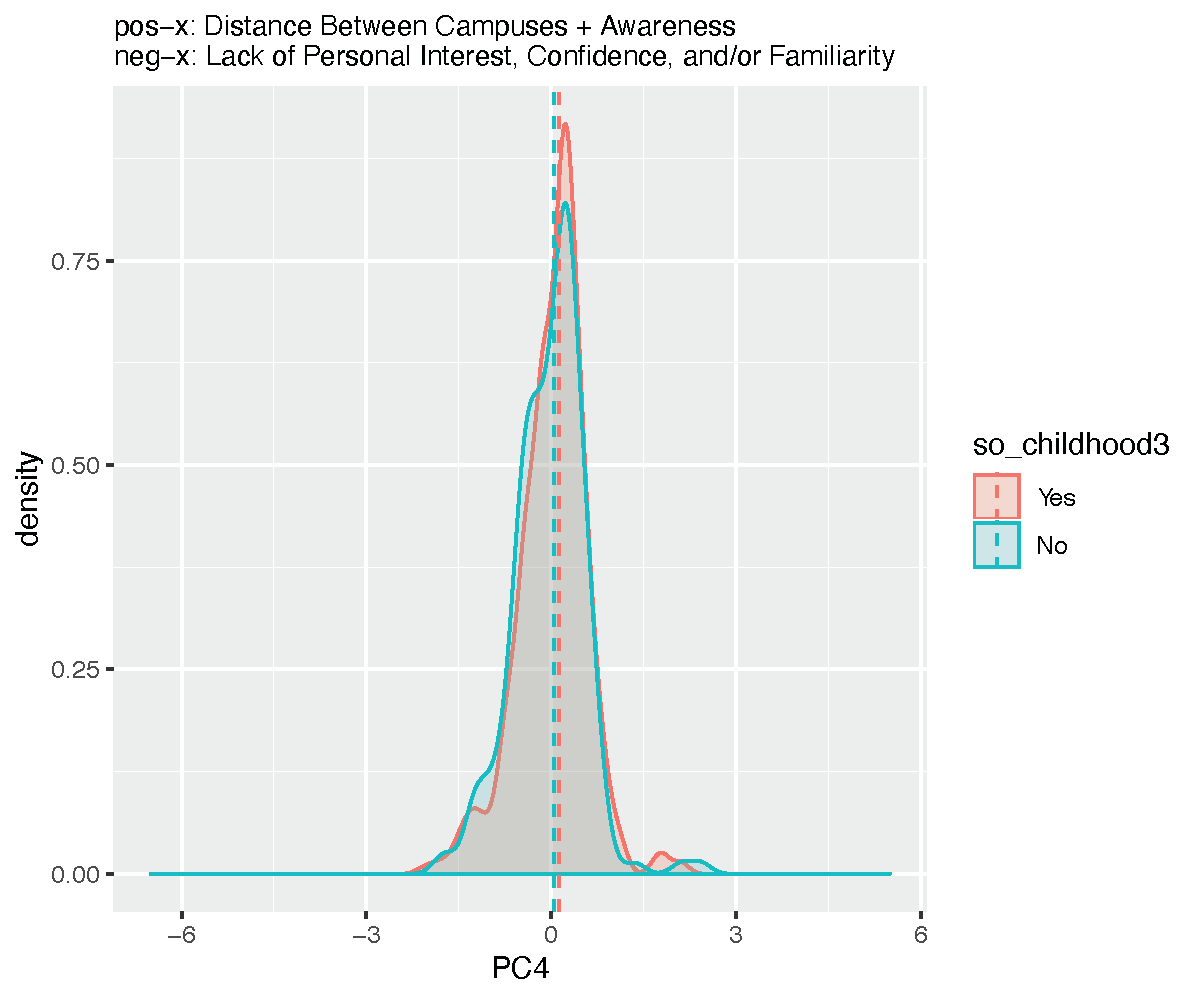
Fig. 19 ABOVE: Density plot of income contrasts Demographic variables that showed contrasts (Tukey adj.p.value < 0.05) between factor levels indicated differences that are unlikely to be due to chance. These differences may suggest an association between the direction of the demographic factors difference and the barriers described by the accompanying dimension/principal component.
so_childhood1
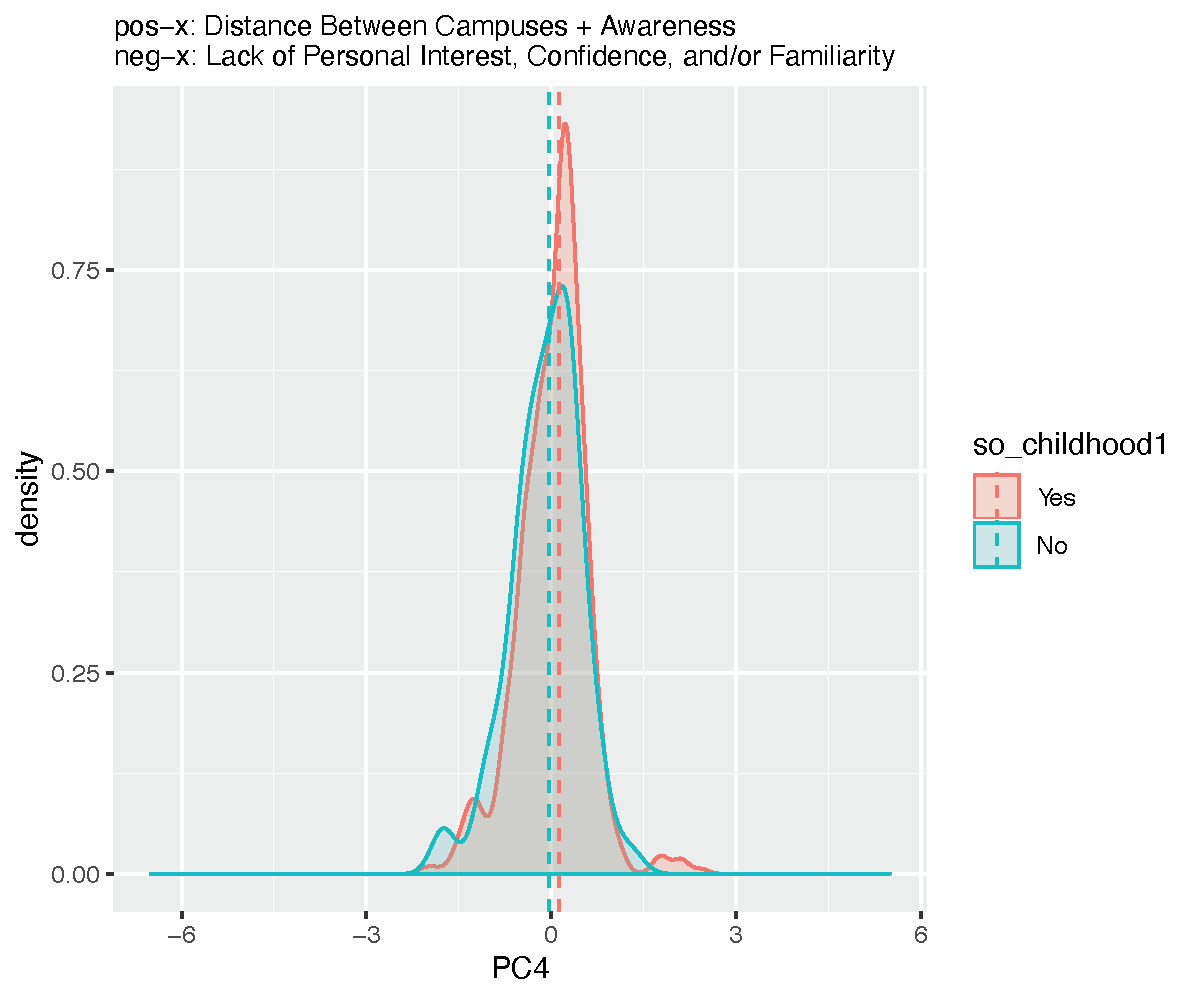
Fig. 20 ABOVE: Density plot of income contrasts Demographic variables that showed contrasts (Tukey adj.p.value < 0.05) between factor levels indicated differences that are unlikely to be due to chance. These differences may suggest an association between the direction of the demographic factors difference and the barriers described by the accompanying dimension/principal component.
sr_participated
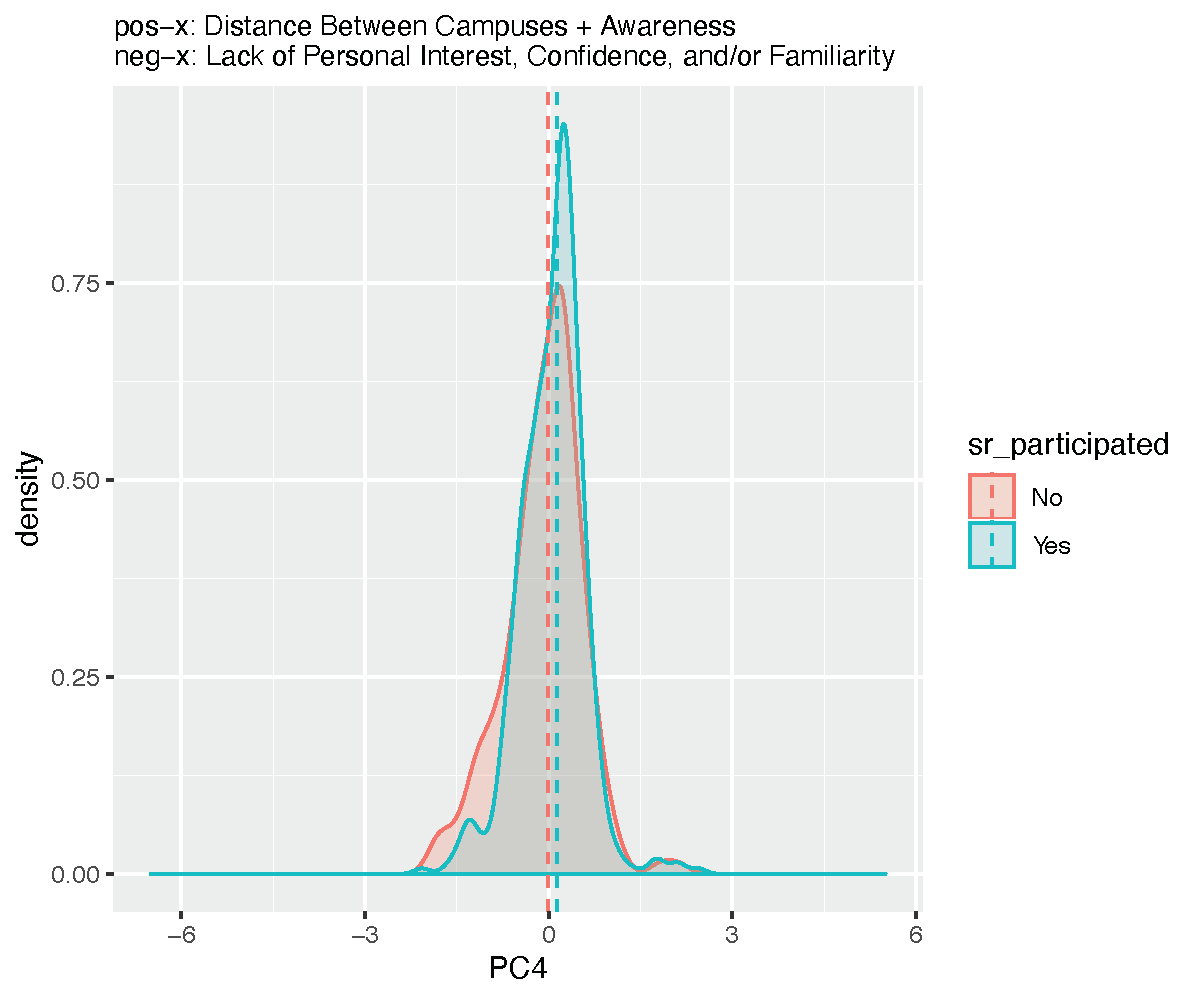
Fig. 21 ABOVE: Density plot of income contrasts Demographic variables that showed contrasts (Tukey adj.p.value < 0.05) between factor levels indicated differences that are unlikely to be due to chance. These differences may suggest an association between the direction of the demographic factors difference and the barriers described by the accompanying dimension/principal component.
hs_arts_freq
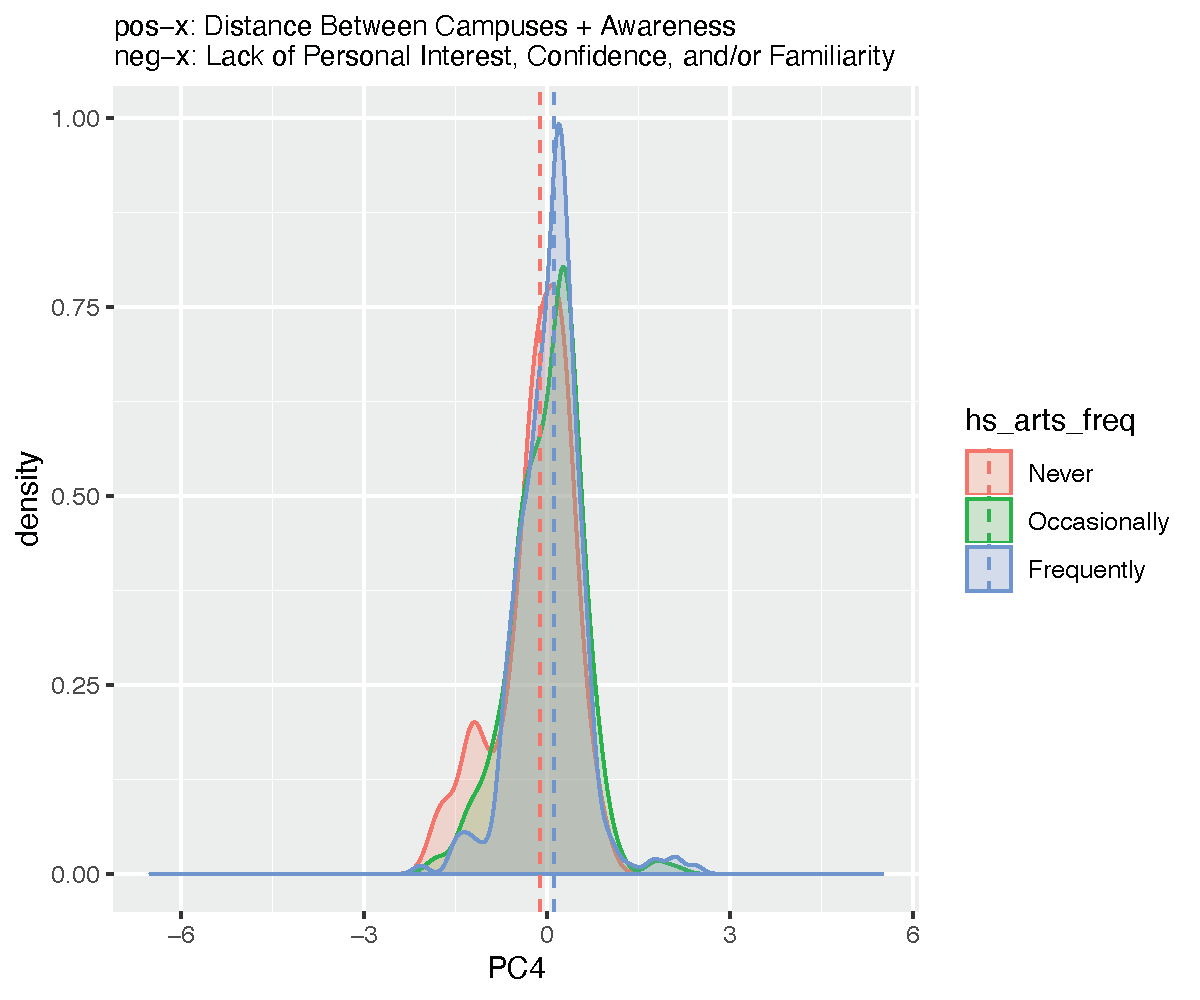
Fig. 22 ABOVE: Density plot of income contrasts Demographic variables that showed contrasts (Tukey adj.p.value < 0.05) between factor levels indicated differences that are unlikely to be due to chance. These differences may suggest an association between the direction of the demographic factors difference and the barriers described by the accompanying dimension/principal component.
artsincollege
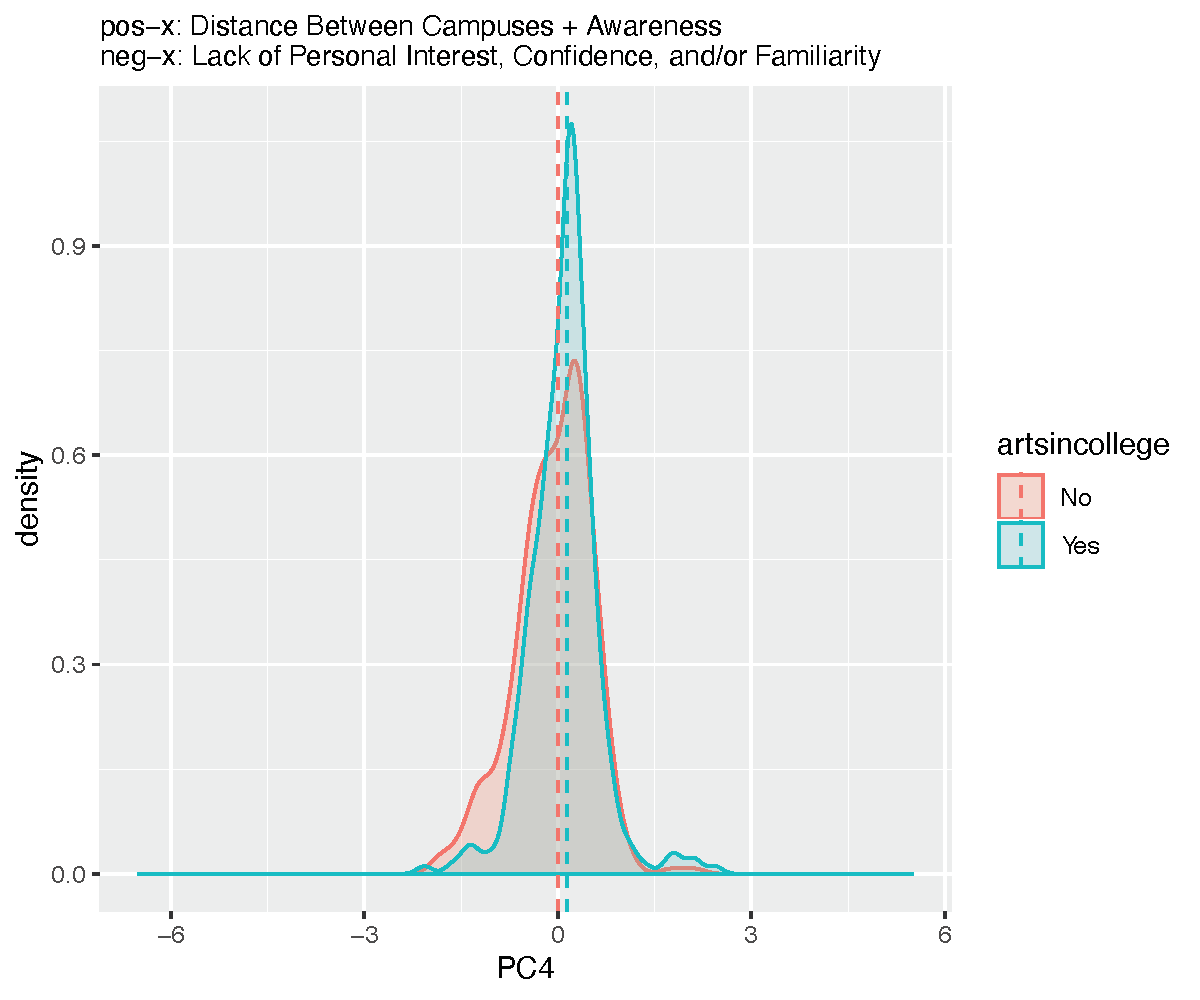
Fig. 23 ABOVE: Density plot of income contrasts Demographic variables that showed contrasts (Tukey adj.p.value < 0.05) between factor levels indicated differences that are unlikely to be due to chance. These differences may suggest an association between the direction of the demographic factors difference and the barriers described by the accompanying dimension/principal component.
Dimension 5: Course Availability -vs- Access: Location and Awareness
Dimension 5 explains about 6% of the variation among responses to the barriers question, and this dimension is characterized by responses focused on Course Availability in one direction, and by responses about Access: Location and Awareness in the other direction. The variables contributing to Course Availability include topic..Fit_With_Major_and_Course_Scarcity, topic..Departmental_Segregation, and topic..Course_Load. The variables contributing to Access: Location and Awareness include LIWC..Authentic, topic..Awareness,LIWC..relativ, topic..Ennui, topic..Distance_Between_Campuses. The variation explained by this dimension is small, but it is included for description because it helps create a fuller picture of the dynamics facing students, their choices, and how they seek to overcome barriers encountered.
Course Availability describes the nexus of academic course offerings, co-curricular opportunities, the level of a course relative to the student’s proficiency, the constraints of one’s major, and the fit, sequence, and timing of scheduling, as well as one’s overall course load.
“There aren’t a lot of arts opportunities (that I have been informed of) available for science majors or others who are not necessarily majoring or well-trained in arts but still do want to be involved. For example, I am a Neuroscience major, but I enjoy creating visual art and have recently gotten involved in graphic design to promote a non-arts club I am in. There should be more opportunities to be parts of less intensive arts groups, if that is possible!”
“Not enough classes tailored for raw beginners. For example, if there had been free-hand drawing classes that were designed specifically for people who may not have nearly any experience with drawing (or who may not be very good), I would probably have taken one. Maybe these classes did exist, and I just didn’t find them, but if that’s true, the course guide should probably be more clear about which classes are for absolute beginners with very little experience or skill.”
“Cannot find beginner art class (for non-majors) that I could take”
“My major is in a non-arts field, and is not in LS&A, which limits my exposure to and eligibility for participation in certain LS&A activities.”
“The theater scene is very limited to non-theater majors. Non-theater majors are rarely cast in any student productions and almost never in University Productions.”
“Sometimes try-outs make it difficult for more novice dancers to get the experience they need to improve their skills. also, you must be a dance major to take upper-level dance classes, which is not fair.”
“Stupid credit requirements. The school of music doesn’t realize the problems they have caused by requiring students to take Glee clubs for credits”
Access: Location and Awareness describes how the interactions between information about courses, opportunities, groups, and events and the location of where activities are being held relative to students’ ability to access those activities.
“Knowledge/awareness of groups, knowing how to join”
“Unawareness. People who live off-campus don’t seem to be aware of a lot of awesome things/cultural/arts events.”
“Lack of awareness. I find it easy to be involved in the Arts as an RC student. I find that many students don’t know about the opportunities available like classes, clubs and events.”
“Lack of awareness, and time conflicts with difficult classes. Availability”
Demographic Factors for Dimension 5
Students for whom a Doctoral or professional degree was their highest degree planned were more likely than those planning on a Bachelor’s degree to cite course availability as a barrier. This is presumably because their perceived time and remaining course options are more limited in their current matriculation status than they would be if they planned to pursue graduate education.
Women were more likely than men to cite Access: Location and Awareness as a barrier. Given the somewhat higher overall engagement in the arts by women, potential differences in technology usage providing access to information, well-documented sex differences in access to resources, as well as challenges in getting to and from rehearsals and other spaces may contribute to this contrast.
TABLE 5: demographic contrasts for Dimension 5
| question_name | PC_num | demographic | comparison | estimate | tukey adj.p.value |
|---|---|---|---|---|---|
| barriers | PC5 | sr_highestdegreeplanned | Doctoral or professional degree-Bachelor’s degree | -0.195418832 | 0.016687737 |
| barriers | PC5 | sex | Female-Male | 0.1907406 | 5.37E-07 |
Sex
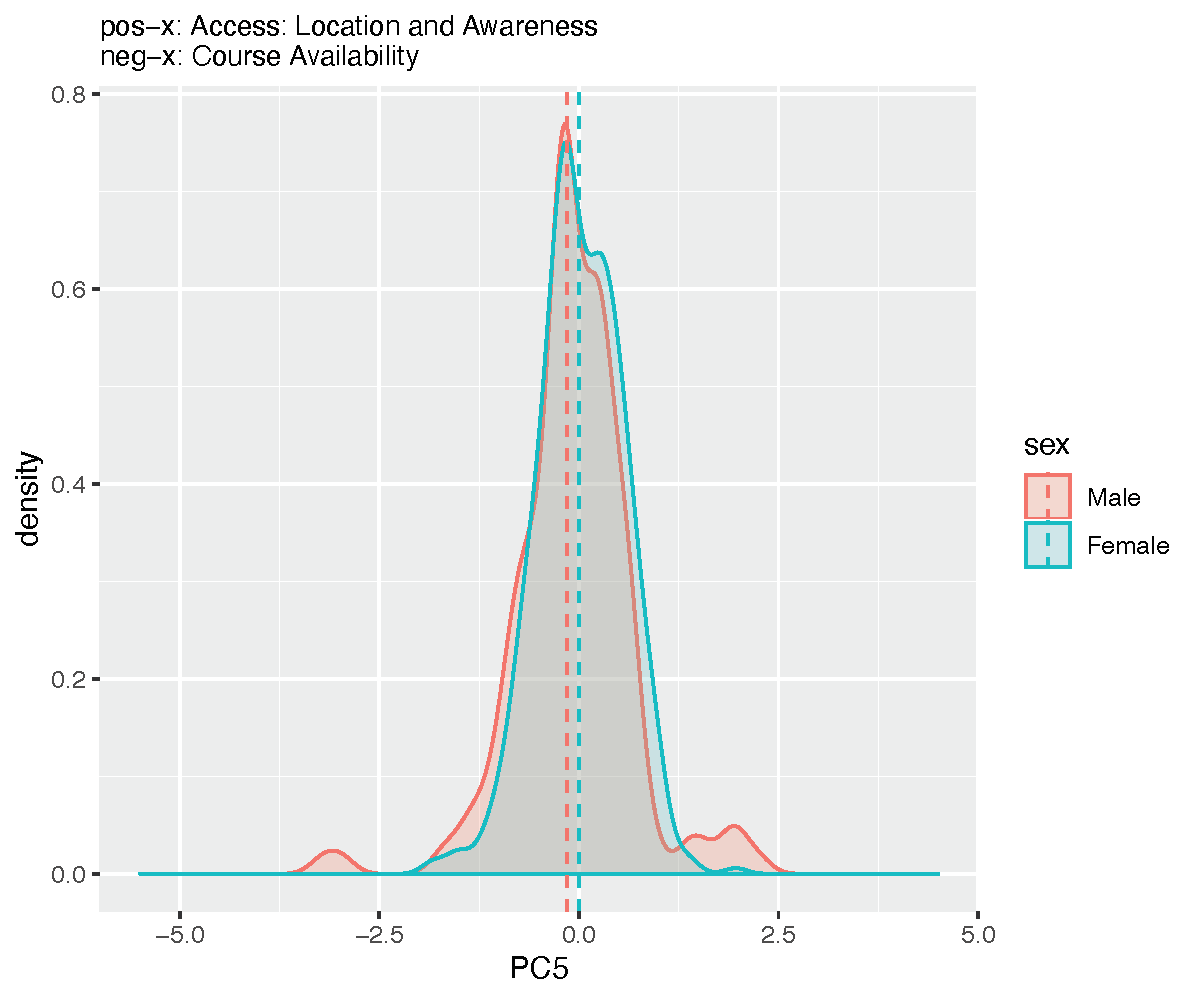
Fig. 24 ABOVE: Density plot of income contrasts Demographic variables that showed contrasts (Tukey adj.p.value < 0.05) between factor levels indicated differences that are unlikely to be due to chance. These differences may suggest an association between the direction of the demographic factors difference and the barriers described by the accompanying dimension/principal component.
sr_highestdegreeplanned
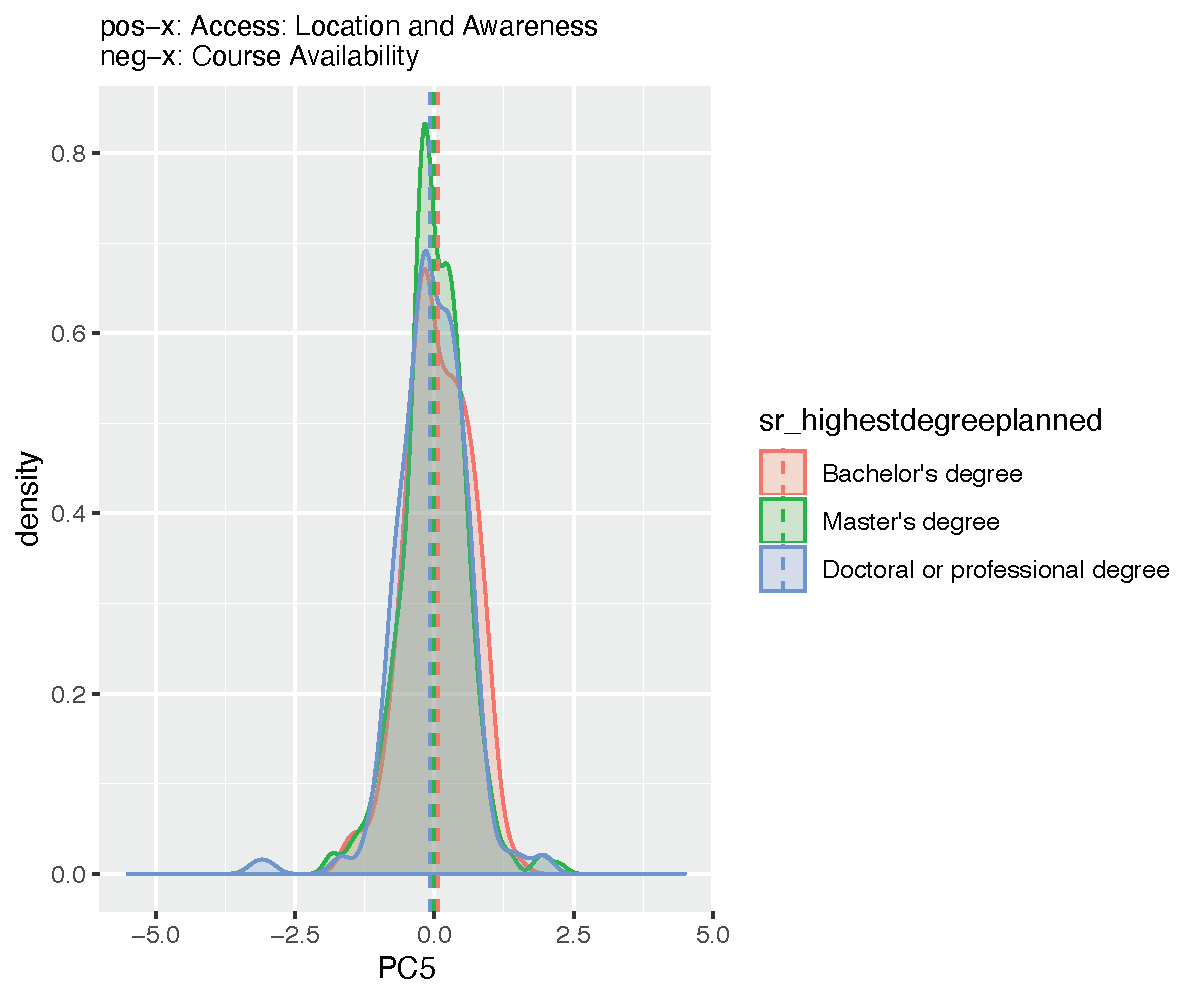
Fig. 25 ABOVE: Density plot of income contrasts Demographic variables that showed contrasts (Tukey adj.p.value < 0.05) between factor levels indicated differences that are unlikely to be due to chance. These differences may suggest an association between the direction of the demographic factors difference and the barriers described by the accompanying dimension/principal component.
Selecting the Dimensions
Scree Plot and Explained Variance
This scree plot shows the explained variance of each of the dimensions and helps illustrate the criteria used for selecting the number of dimensions to be studied. In general, dimensions were included that helped account for at least 50% of the cumulative variance, leaving those dimensions that explained less than about 6% of the response variation uninterpreted.
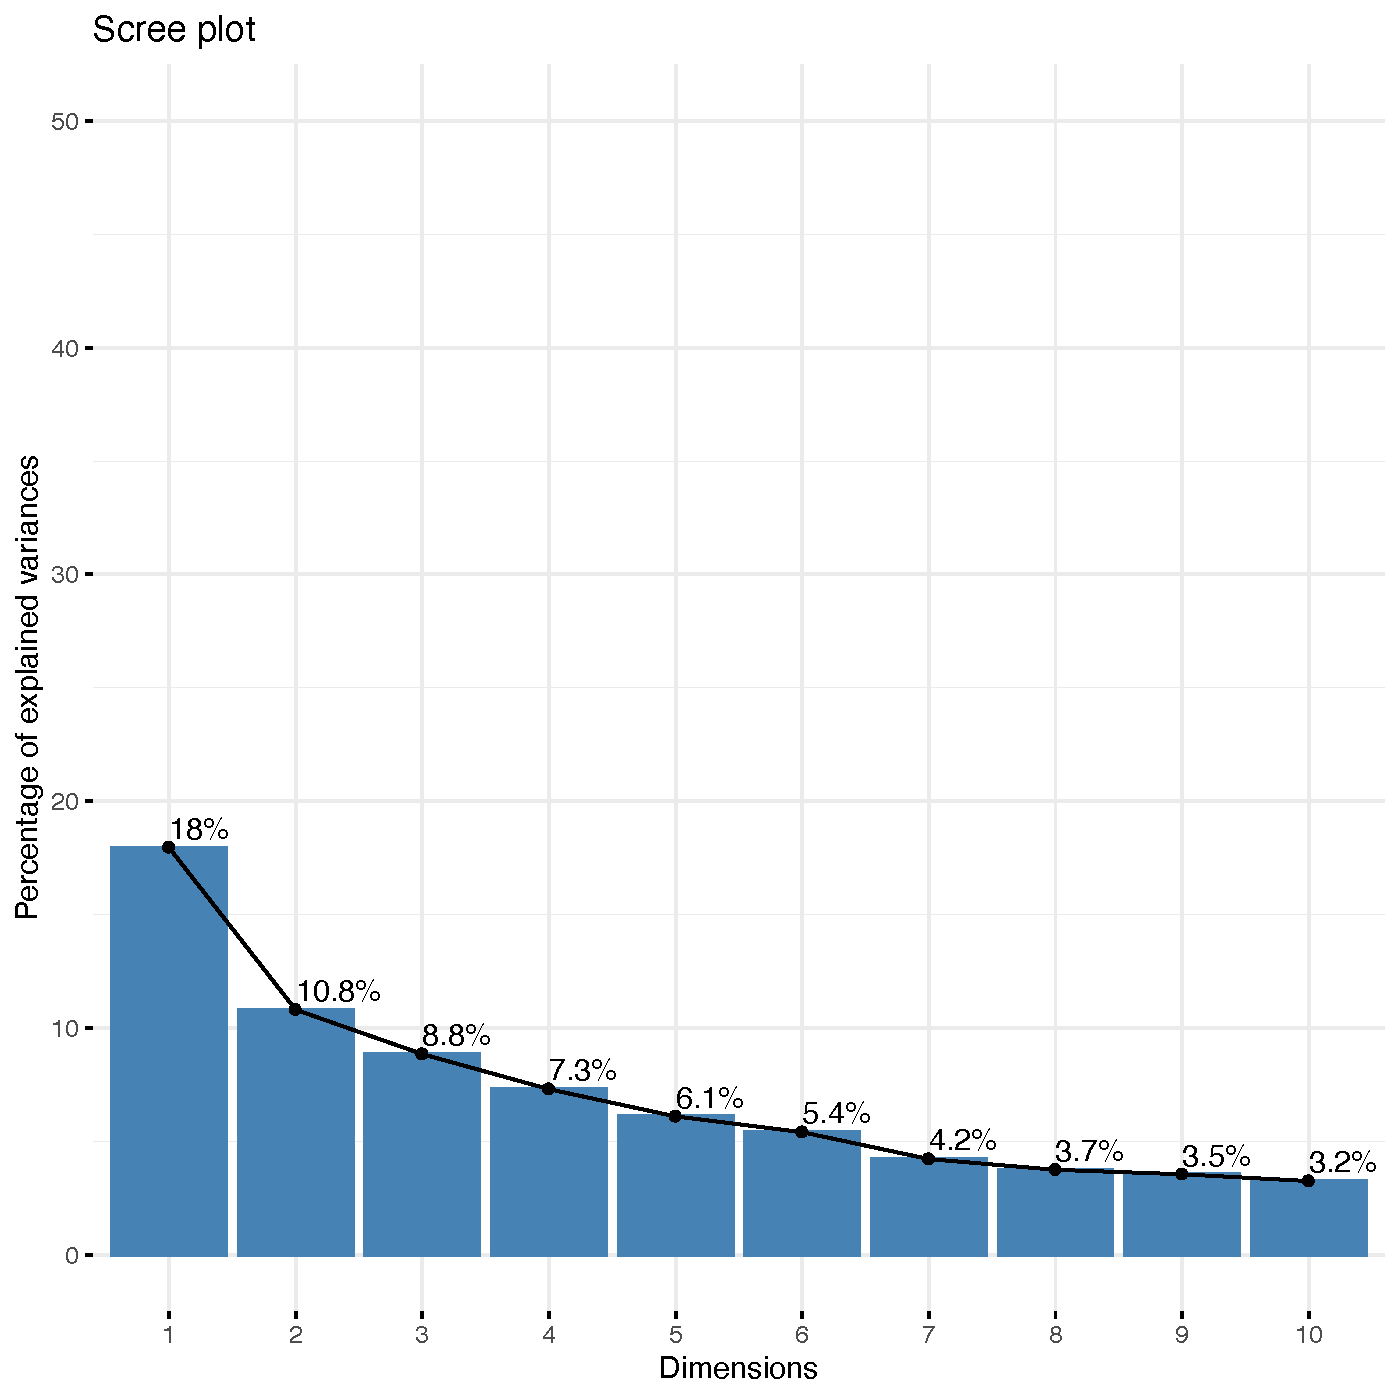
Fig. 26 ABOVE: Barriers Scree Plot
Eight components had an eigenvalue greater than 1. The eight components accounted for 64% of the variation among the responses. Five dimensions explaining a cumulative 51% of the variation were extracted for further description.
| Barriers PC | eigenvalue | variance.percent | cumulative.variance.percent |
|---|---|---|---|
| Dim.1 | 4.85E+00 | 1.80E+01 | 17.95625 |
| Dim.2 | 2.92E+00 | 1.08E+01 | 28.75957 |
| Dim.3 | 2.39E+00 | 8.85E+00 | 37.60513 |
| Dim.4 | 1.97E+00 | 7.30E+00 | 44.90487 |
| Dim.5 | 1.65E+00 | 6.10E+00 | 51.00094 |
| Dim.6 | 1.46E+00 | 5.40E+00 | 56.40384 |
| Dim.7 | 1.14E+00 | 4.22E+00 | 60.61931 |
| Dim.8 | 1.01E+00 | 3.74E+00 | 64.36249 |
Loadings Table for Variables Included in the Analysis
The table of loadings shows the loadings of all of the variables for each of the principal components studied for barriers. Loadings with absolute values greater than 0.2 have been considered the most important for interpreting and describing each principal component.
| BARRIERS | PC1 | PC2 | PC3 | PC4 | PC5 |
|---|---|---|---|---|---|
| topic..Unwelcoming_Environment | 0.3362 | -0.0582 | 0.0018 | 0.0054 | 0.0746 |
| topic..Competitive_Auditions | 0.2743 | -0.0765 | 0.05 | -0.0571 | 0.0684 |
| topic..University_Priorities | 0.2442 | -0.1282 | 0.0322 | 0.0968 | -0.1338 |
| topic..No_Barriers | 0.2257 | 0.0489 | 0.0092 | -0.0766 | 0.0815 |
| topic..Accessibility | 0.2197 | -0.0943 | 0.0242 | 0.1639 | 0.111 |
| topic..Departmental_Segregation | 0.2075 | -0.1743 | 0.0117 | 0.1163 | -0.3114 |
| topic..Ennui | 0.2038 | 0.2043 | -0.004 | -0.0387 | 0.2905 |
| topic..Lack_of_Familiarity | 0.1971 | -0.0193 | 0.0167 | -0.3439 | -0.043 |
| LIWC..function | 0.1867 | 0.4365 | -0.0557 | 0.1793 | -0.1162 |
| topic..Cost | 0.1835 | -0.0961 | -0.0104 | 0.1493 | 0.1898 |
| topic..University_Program_Requirements | 0.1819 | -0.0901 | 0.0031 | 0.0132 | -0.1386 |
| LIWC..Tone | 0.1679 | 0.0387 | 0.0206 | -0.1664 | 0.0339 |
| topic..Low_Confidence | 0.1475 | 0.0209 | 0.0163 | -0.4336 | -0.001 |
| topic..Awareness | 0.1378 | -0.041 | 0.0271 | 0.2838 | 0.3595 |
| AIC..DIAL | 0.0392 | -0.0563 | -0.5517 | -0.0197 | 0.0338 |
| AIC..IC | 0.0375 | -0.0624 | -0.6297 | -0.0468 | 0.0202 |
| AIC..ELAB | 0.0288 | -0.0453 | -0.5197 | -0.0595 | -0.0053 |
| topic..Fit_With_Major_and_Course_Scarcity | 0.0258 | -0.1584 | -0.0089 | 0.1245 | -0.4329 |
| topic..Distance_Between_Campuses | -0.0152 | -0.0935 | 0.0266 | 0.327 | 0.2197 |
| LIWC..Clout | -0.0155 | -0.3862 | 0.0645 | -0.1783 | -0.0194 |
| topic..Lack_of_Personal_Interest | -0.0497 | 0.1388 | 0.0632 | -0.4678 | 0.1248 |
| LIWC..Analytic | -0.0794 | -0.4316 | 0.0696 | -0.1921 | 0.0094 |
| LIWC..Authentic | -0.1148 | -0.1275 | -0.0298 | 0.1215 | 0.3833 |
| topic..No_Barriers,_Except | -0.1487 | 0.4273 | -0.0357 | -0.0424 | -0.011 |
| LIWC..relativ | -0.2378 | -0.2688 | -0.002 | -0.0717 | 0.3031 |
| topic..Course_Load | -0.3076 | -0.0645 | -0.0528 | 0.1729 | -0.2681 |
| topic..Time | -0.3983 | 0.0786 | -0.032 | -0.053 | 0.08 |

